


Infertility is defined by the World Health Organization (WHO) in terms of clinical and epidemiological aspects. Clinically, infertility is a “disease of the reproductive system defined by the failure to achieve a clinical pregnancy after 12 months or more of regular unprotected sexual intercourse.” Epidemiologically, it is defined as “women of reproductive age at risk of becoming pregnant who report unsuccessfully trying for pregnancy for more than two years”.1 Demographers generally define infertility as an absence of live birth in a sexually active, non-contracepting female, considering the inability to have any children either due to infecundity, miscarriage, spontaneous abortion, or stillbirth in not less than five years.2 Measures produced by the demographic definition are important to understand the magnitude, distribution and underlying trends of infertility at a population level.1 Infertility is often categorised as primary infertility due to the “absence of a live birth or secondary infertility due to the absence of another live birth for a couple in union and during which period neither partner used contraception and where the female partner expresses desire for a child”.1
According to WHO, at least 50 million couples worldwide experienced infertility in 2017. A systematic review of 277 health surveys concluded that one in every four couples in low- and middle-income countries (LMICs) had been found to be affected by infertility.3 The African region had the highest period prevalence of infertility at 16.4% in 2019, followed by the western Pacific (13%) and European (12.4%) regions.3 According to a recent secondary analysis of Demographic and Health Surveys (DHS) from 16 countries in sub-Saharan Africa, including Uganda and Southern Asia, the prevalence of primary infertility was low and ranged from 0.3% in Kenya, 0.8% in Uganda to 3.8% in Senegal.4 The overall prevalence of primary and secondary infertility in the 16 countries was 2% and 19%, respectively.4
Infertility has negative consequences on the social, economic, and psychological well-being of affected individuals, families, and communities. Compared to high-income countries, in LMICs it is associated with deeper feelings of fear, guilt, self-blame, marital dissatisfaction, depression, helplessness, spousal or social violence, isolation, severe economic deprivation, and suicide.5
In LMICs, infertility care has been perceived as suboptimal, as services to prevent and treat infertility are often inaccessible, unaffordable, or non-existent. There is an urgent call for the integration of infertility into global reproductive health services and practices to promote safe, effective, dignified fertility care among those in need.6 The policy perspectives of some policymakers towards the provision of infertility care in LMICs have been mostly either dismissive or indifferent, as they argue that scarce health resources should be directed towards reducing fertility and restricting population growth.7
Recently, there has been growing interest in closely monitoring how health indicators can highlight the needs of vulnerable populations, including individuals and couples with infertility and track how their needs can be addressed through policies and programs.8 However, health systems’ readiness to track and address infertility in sub-Saharan Africa remains dire. Given the high level of individual and local heterogeneity within geographic or administrative units, effective infertility policy designs require a detailed knowledge of the distribution of infertility and its various determinants.
In this study, we aimed to establish the prevalence, the regional distribution, and determinants of infertility in Uganda. We believe that the findings of this study will add to the growing evidence base, which could be used to inform policies and strategies to prevent and treat infertility in Uganda and other similar low-resource settings.
METHODS
Study design
We used data from the three Uganda Demographic and Health Surveys (UDHSs): 2006,9 201110 and 2016.11 The Demographic Health Survey (DHS) is a cross-sectional, nationally representative survey which uses standard questionnaires that are adapted to meet country needs.12 DHS uses a multi-stage cluster sampling design, with the most recent population census as a sampling frame. A complete list of clusters is developed from the sampling frame, and from this list, the clusters are stratified to ensure that a representative sample is drawn for each stratum. In 201611 the survey sample was designed to be representative at the national and regional levels and for urban and rural areas, while in 20069 and 201110 the sample was only representative at national levels and urban and rural areas. Clusters are randomly selected with probability proportional to size. Within each selected clusters, all households are listed, and 20-30 households are randomly selected.
Within each selected household, all women aged 15-49 are interviewed. At least three attempts are made to interview each eligible woman. To get statistics that are representative of Uganda, the distribution of the women in the sample was weighted (mathematically adjusted) such that it resembles the true distribution in the country. With sampling and weighting, it was possible to interview enough women to provide reliable statistics at national and regional levels.
Informed consent was obtained from participants before data were collected using interviewer administered questionnaires. The questionnaires include sections on household and individual socio-demographic characteristics, fertility, reproductive health, birth history, desire to have a child and contraceptive use, among others.
Study population
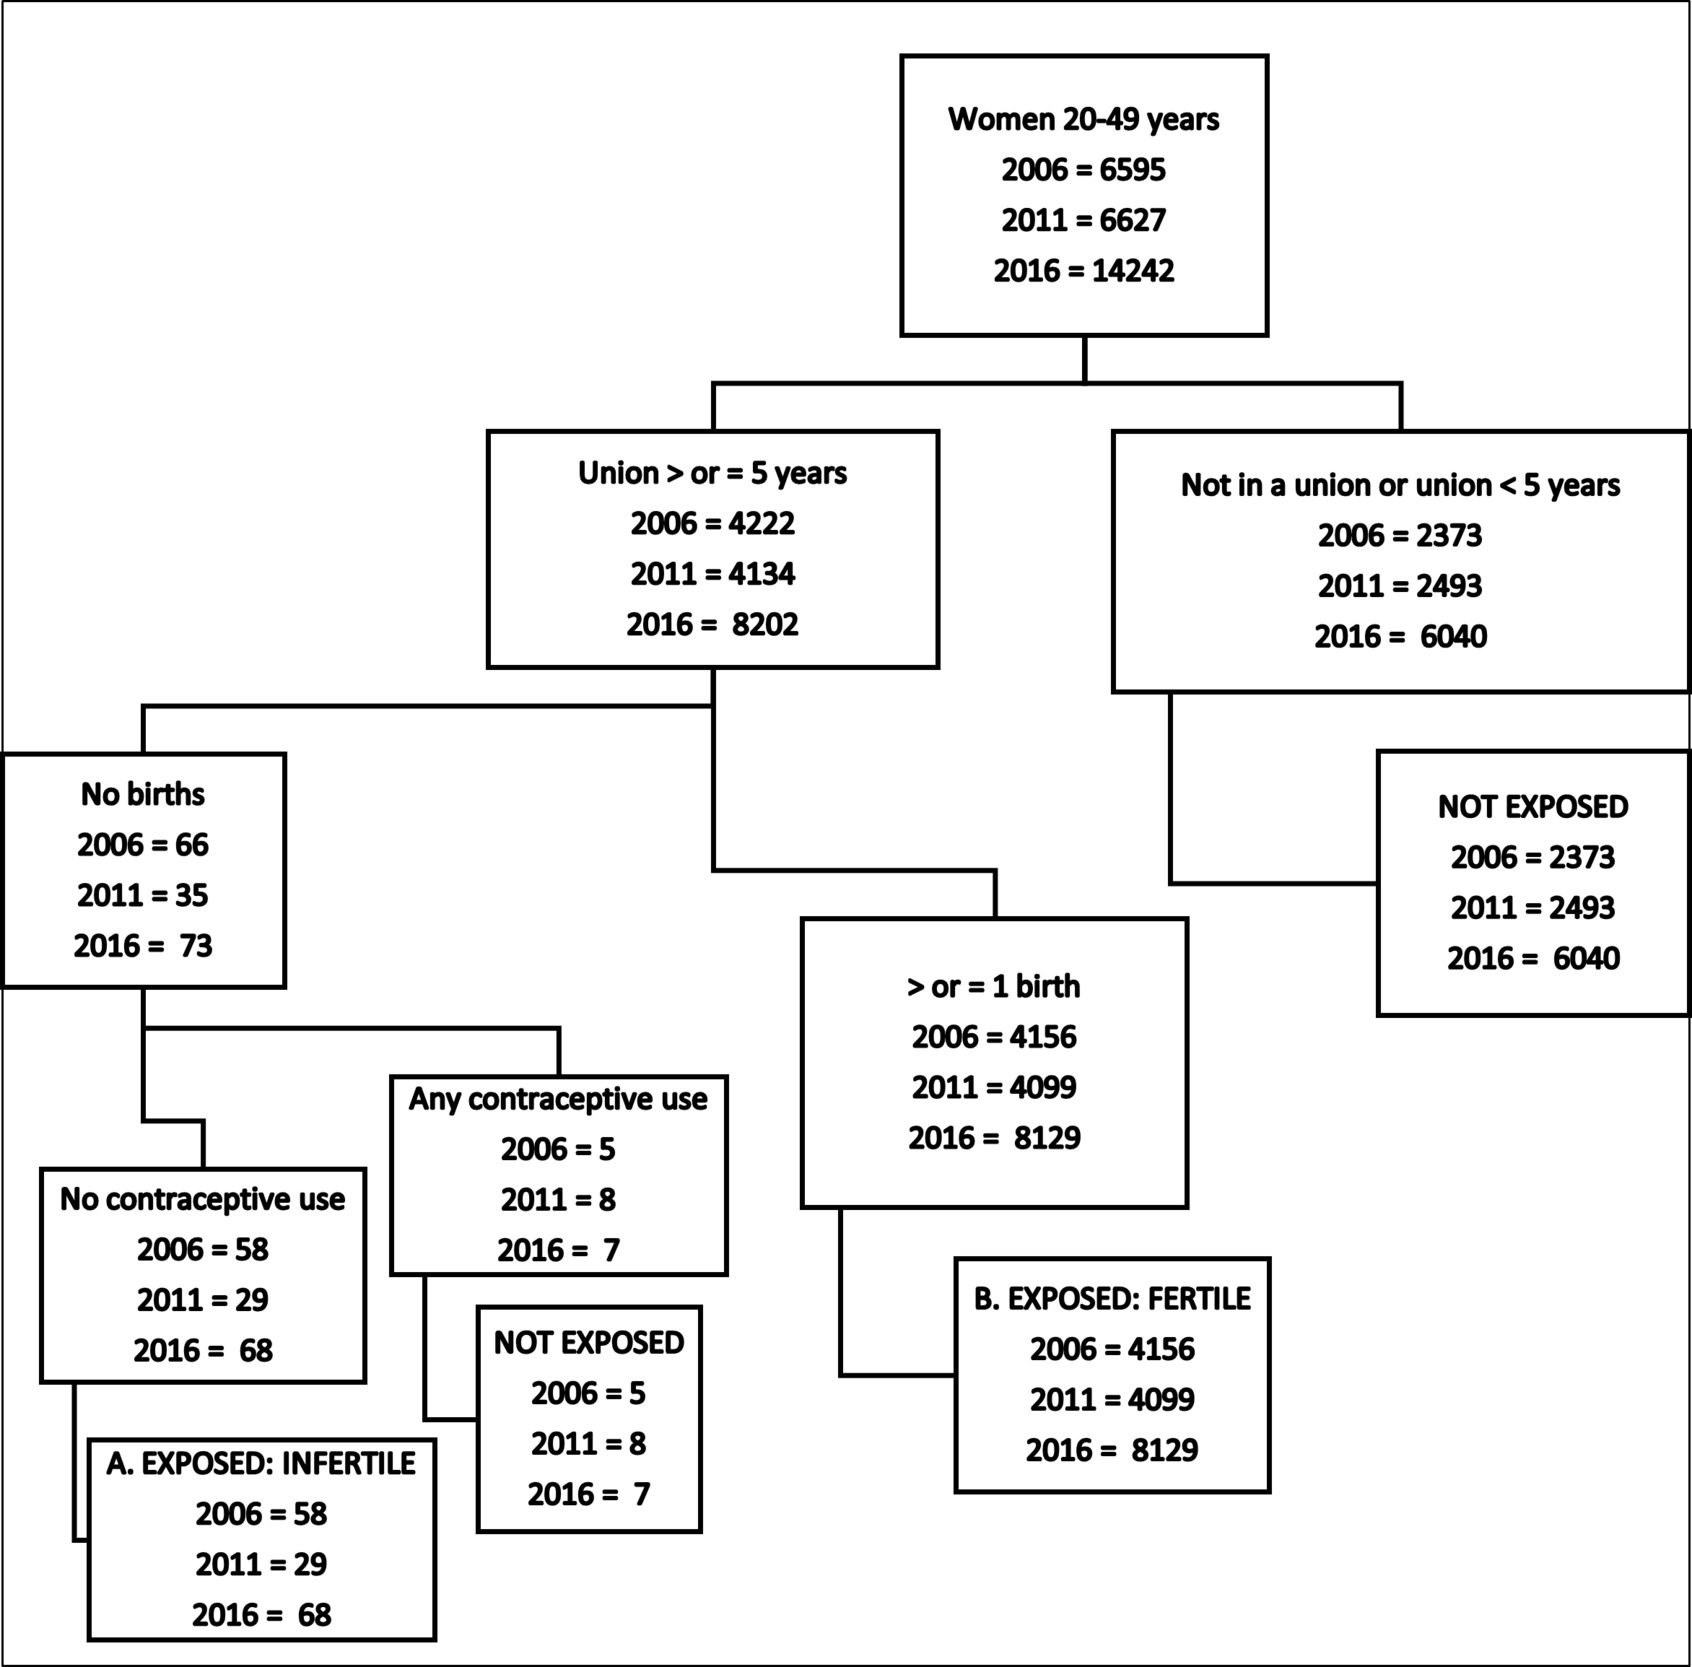
Our study population was women aged 20-49: 6,595, 6627 and 14,242 for 2006, 2011 and 2016 respectively. The choice of the group 20-49 years was based on the reproduction lifespan of an individual13 and their capacity to make decisions regarding fertility, contraception, family planning and unions. We excluded adolescents 15-19 years, only because they did not meet the inclusion criteria, for having been in a union five or more years.
Our analysis sample included: (1) For primary infertility, we examined 4,214, 4,128 and 8,195 women for the years 2006, 2011 and 2016, respectively and (2) For secondary infertility, 3,348, 3,269 and 6,011 women in 2006, 2011 and 2016 surveys, respectively.
Definitions of variables and categorisation
Infertility: a woman at risk of becoming pregnant who reports unsuccessful trying for pregnancy for five or more years of exposure to become pregnant, during which neither she nor her partner used contraception.14
Primary infertility: Couples without a live birth, despite being in a union for at least five years during which neither partner used contraception, and the female partner expressed desire for a child.14 (Figure 1).

Secondary infertility: the absence of a live birth for couples who have been in a union for at least five years since the female partner’s last live birth, during which neither partner used contraception, and where the female partner expresses a desire for a future child14 (Figure 2).

Age group: Age in completed years at the time of the survey, categorised as 20- 29, 30- 39, and 40-49 years.
Highest education level: The highest level attained at the time of the survey, that is, No education, Primary or Secondary, or higher levels of education.
Household wealth quintile: Wealth quintiles are generated by the DHS and are distributed into five equal categories, that is, lowest (poorest), second, middle, fourth and highest (wealthiest).
Place of Residence: country-specific definition of residence (urban or rural).
Women’s relationship status: At the time of the survey, whether the respondent was married, cohabiting, divorced, separated, widowed, or single (never married).
Zone: geographical zones of women’s place of residence, categorised as Northern, Eastern, Western and Central regions. The regions were re-categorised into Central, North, Western and East zone. This was done in order to harmonise geographical areas across the three surveys due to changes in regional boundaries over time, as done by other studies.15 The Central zone covers Kampala, South Buganda, and Northern Buganda regions. The northern zone includes Lango, Acholi and West Nile regions. The eastern zone was composed of Teso, Karamoja, Bugishu, Bukedea and Busoga regions. The Western zone was composed of Bunyoro, Tooro, Ankole and Kigezi regions.
Religion: Woman’s religion at the time of the survey was categorised as Anglican (Anglican and Pentecostal/Born again evangelical), Catholic, Muslim and Others (Seventh Day Adventist, Orthodox, Baptist, Traditional, No religion, Jehovah’s Witness, other).
Employment status: Women who had done paid work in the 7 days preceding the survey were categorised as regularly employed.
Data analysis
We used Stata version 16 Stata Corp I.P Texas to perform descriptive and analytic statistics. We combined the DHS data over the three survey years to be able to . Two separate data sets were created for primary infertility simultaneously describe and secondary infertility because of analyse the difference in definition, formulae, and assumptions, particularly data across all the denominators, (Figure 1 and 2) survey years. We then summarised respondent characteristics by primary and secondary infertility for the three surveys. We determined the prevalence of infertility (primary and secondary) and the corresponding 95% confidence intervals nationally in each of the 3 surveys ,using the demographic definition, formulae and assumptions developed by Mascarehas and colleagues.14 Figures),We used weighted analyses and survey sets to account for the multi-stage cluster sampling design of the DHS.

To assess the determinants of infertility and regional variation, we performed logistic regression with robust standard errors to adjust for clustering on the pooled data, separately for primary and secondary infertility.; The survey years, zones, age, education level, household wealth, and religion were included as covariates. Multicollinearity was ruled out by obtaining variance inflation factors (VIF); none of the VIFs was greater than 5. We did backward modelling and removed variables that were non-significant, having set the significance P-value at 0.05. We subjected the multivariable model to the Hosmer-Lemeshow test of goodness fit.16
Ethical approval and consent to participate
The three rounds of DHSs received permission from the Ugandan government, and written consent of women to participate in the surveys was obtained . In addition, we obtained permission to access and use datasets from the DHS program. by DHS enumerators at the time of data collection.
We received ethical approval from the Makerere University School of Public Health Regulatory Ethics Committee and Uganda National Council of Science and Technology (UNCST) (REC Protocol number: SPH-2023-525) to conduct this secondary data analysis.
RESULTS
Socio-demographic characteristics of participants
The analysis sample of women aged 20 - 49 years included in the Uganda Demographic Health Survey (UDHS) of 2006, 2011 and 2016 consisted of a total of 16,357 women for primary infertility and 12,628 women for secondary infertility (Table 1). The percentage of women who lived in rural settings was 90% in 2006 and 80% in 2016. Most women ( more than 60% in all three surveys) had attained primary education. Most of the women (64%) were married at the time of the survey. The proportion of Christians (Anglicans and Catholics combined) was 78%, 71%, and 70% in 2006, 2011, and 2016, respectively.
Prevalence of infertility
The prevalence of primary infertility dropped from 1.4% (95% Confidence Interval (CI)= 1.0-1.8) in 2006 to 0.7%(95% CI= 0.5-1.0) and 0.8% (95% CI= 0.6-1.0)in 2011 and 2016, respectively. The prevalence of secondary infertility remained almost the same over the three surveys at 7.4% (95% CI= 6.5-8.4), 6.9% (95% CI= 5.9-8.0) and 7.1% (95% CI= 6.4-7.9) in 2006, 2011 and 2016, respectively.
Geographic variation in infertility
The prevalence of primary infertility was similar across the four zones over the survey years. Secondary infertility was highest in the Central zone at 6.2% (95% CI= 4.6-8.1), 9.2% (95% CI= 6.9-12.1) and 7.9% (95% CI= 6.1-10.3) and in the Northern region at 8.7% (95% CI= 7.0-10.8), 8.1% (95% CI= 6.5-10.1), 7.4% (95% CI= 6.1-8.9) in 2006, 2011 and 2016 respectively. It was lowest in the Eastern zone 7.1% (95% CI= 5.5-9.2), 4.6% (95% CI= 3.4-6.4), 6.2% (95% CI= 5.1-7.4) in 2006, 2011 and 2016 respectively, as shown in Table 2.
Factors associated with infertility
Primary infertility was lower in both 2011 and 2016 compared to 2006; (adjusted odds ratio (aOR) =0.55, 95% CI= 0.35 - 0.86, p=0.009) and (aOR=0.62, 95% CI= 0.43 - 0.90, p=0.011), respectively. The odds for primary infertility was higher among women aged 40-49 years ((aOR 1.99 (95% CI= 1.31 - 3.32) p.0; p<0.001) compared to those aged 20 to 29. Compared to the lowest wealth quintile, primary infertility was significantly higher in all the other categories. There was no significant difference in the prevalence of primary infertility according to place of residence, level of education, employment status, or religion (Table 3).
Secondary infertility was lower in the Eastern and Western regions compared to the Central region, (aOR=0.72, 95% CI= 0.58 - 0.91, p=0.005) and (aOR=0.79, 95% CI=0.63 - 0.99, p=0.039, respectively). Secondary infertility was higher among women aged 30 to 39 and 40 to 49; (aOR=2.64, 95% CI= 2.12 - 3.28, p<0.001) and (aOR=13.15, 95% CI= 10.59 - 16.32, p<0.001), compared to those aged 20-29 years. Secondary infertility was lower among women with higher education (aOR= 0.54, 95% CI= 0.35 - 0.83; p < 0.001, compared to those with no education), but higher among women from wealthier households compared to the poorest (Table 4).
DISCUSSION
This study aimed to establish the prevalence, the regional distribution and determinants of infertility in Uganda. Primary infertility affects about an average of 0.97% (± 0.38) of women and seems to have declined between 2006 and 2016; .13% (± 0.25)secondary affects around 7% of women and remains at the same level, compared to the WHO estimates for the African Region of 16.4%(95% CI= 10 - 25.7), in 2021.
This indicates that infertility in Uganda is a concern affecting a substantial proportion of women in Uganda. The prevalence of primary infertility in our study was lower than secondary infertility, similar to the findings by Mascarenas from the 1990s (2%; 95% CI= 1.9 - 2.2) to 2010 (1.9%; 95% CI= 1.7 - 2.2). This shows that the prevalence of primary infertility over the years has not changed much. However, secondary infertility in the sub-Saharan region was lower than was found by Mascarenas and others. They found secondary infertility in the sub-Saharan region to be 13.5% (95% CI= 12.5 - 14.5) (1990) and 11.6% (95% CI= 10.6 -12.6) (2010).17 This was contrary to findings by Abebe,18 which was 8-fold higher (49.9%, 95% CI= 41.34 -58.48) and the same for primary and secondary infertility across Africa. On the other hand, our findings were the same as more recent findings by Riese et al (4% (95% 0.5 - 8), who found the overall prevalence to be 6.4). in Uganda.
The Central and Northern regions of Uganda showed high rates of secondary infertility, and the rates of primary and secondary infertility in other regions remained the same across the sampled time frame. The regional difference may warrant further investigation to understand the underlying factors contributing to higher secondary infertility rates in the regions of the country. The prevalence of both primary and secondary infertility was the same in rural and urban areas, despite the settings not being homogeneous with differences including access to education opportunities, health opportunities and other service amenities.
We found a high prevalence of secondary infertility among those with no formal education compared to those with primary and secondary education. Though the lack of formal education does not directly contribute to infertility, it leads to limited access to information about reproductive health, contraceptive methods, sexually transmitted Infections (STIs), family planning,19 and family planning,19 which are linked to the occurrence of infertility. There is a strong correlation with low socio-economic status, which leads to limited access to health care, regular checkups, preconception counselling, and overlooking of early intervention of reproductive issues.20 Lack of formal education has also been associated with unhealthy lifestyles such as smoking, excessive alcohol consumption, poor nutrition and inadequate exercise, which negatively affect fertility in both men and women.21
Despite the prevalence of infertility being higher among those with no formal education, more women have attained primary and secondary education in the country over the years. This can be attributed to the introduction of Universal Primary Education (UPE) and Universal Secondary Education (USE) by the Uganda government in 1997 and 2007, respectively. This may have contributed to fewer women seen with secondary infertility in 2016 compared to those reported by Mascarenhas.12 Women with no formal education have limited access to health education, including education on treatment and prevention of STIs.22 STIs have been associated with infertility by causing tubal blockage.23 This may explain the high prevalence of secondary infertility we found among those with no formal education compared to those with primary and secondary education.
Higher education, however, often correlates with delayed childbearing due to career aspirations or personal goals. Delayed childbearing increases the risk of age-related infertility, as seen among women aged 40 years and above. Women 40 years and above are also deemed to be at the end of the reproductive window, and other factors, including a diminished ovarian reserve, may contribute to this.24
In India, Syamala et al. found that women in the urban areas and better educated had a higher prevalence of infertility.25 However, this was different from the case in Bangladesh, where the prevalence of secondary infertility was high among women aged 20-34 years compared to those aged 35 years and above. This was also irrespective of whether they lived in urban or rural areas.19
In Uganda, the availability of infertility care services is the mandate of district and regional referral hospitals. There are 205public and private hospitals and each of these hospitals has at least one or two gynecologists. However, the extent to which infertility care services are offered in these facilities is not well-known. For assisted reproductive services, we have 9 IVF clinics; 8 are situated in the central region specifically in Kampala district and one in the western region (Mbarara). The average cost of a fertility consultation is USD 25 and an IVF cost between USD 4500-5500. This is way out of each of the ordinary Ugandan.
In our study, we found that regardless of the category, primary infertility over the survey years was the same for different categories of household wealth index. However, secondary infertility was high among those with the highest wealth quintile. This was similar to Roy’s finding in Bangladesh, where infertility was found to be higher among the richest compared to the poorest.19 This may emphasise that though the wealth index provides a measure of financial security and significantly impacts an individual’s socio-economic status, it is just one of the aspects of socio-economic status and should be taken into context with other factors like age, occupation, and education. Women with a higher wealth index may probably be more exposed to environmental and life-related changes.
Study strengths and limitations
This study derives its strength from the use of data from three standardised, nationally representative surveys in Uganda. This study also separated the data sets during the data management process before the data sets were pooled for analysis. This removed the possibility of having the same women in both data sets for primary and secondary infertility.
Despite this strength, the results must be interpreted casually against these limitations. Globally, there is no standard definition for infertility, which may result in underestimation or overestimation of infertility. The measure of infertility was based on self-reporting of various variables, which may result in an underestimation or overestimation of infertility. Thirdly, definition, two separate data subsets had to be used for primary and secondary infertility. some individuals sampled may have had infertility across all the survey years. ,all the respondents were only women, with men only as a proxy in the relationship as a partner by definitions, yet we know infertility affects both men and women.
Other limitations included residual confounding, missing data, over or under sampling, over fitting resulting from a data driven approach. Considering the variations in population characteristics that may exist in other settings, this data might have limited transferability. We propose future studies to use a longitudinal design to estimate the trends and regional variations of secondary infertility more accurately in Uganda. This can help identify emerging patterns, assess the effectiveness of interventions, and guide ongoing policy adjustments.
CONCLUSIONS
Our results suggest that the prevalence is similar across regions, whereas secondary infertility varies by region, with higher prevalence in the Central and Northern regions. Factors associated with secondary infertility vary across regions, and more research is required to understand the drivers behind the variation of secondary infertility across regions. Effective policy formulation will have to consider these determinants. The findings of this study could be used to inform policies and strategies to address specific regional challenges and promote equitable access to infertility treatments and support services. Regions with higher prevalence of infertility may require additional health care infrastructure to accommodate increased demands for infertility treatment.
Acknowledgements
We are thankful to the team at the Institute of Tropical Medicine Antwerp, Belgium for the support for the DHS course. We are thankful to the DHS program and Uganda Bureau of Statistics for permission to use the UDHS data.
Ethics statement
The three rounds of DHSs received permission from the Ugandan government, and written consent of women to participate in the surveys was obtained. In addition, we obtained permission to access and use datasets from the DHS program. by DHS enumerators at the time of data collection. We received ethical approval from the Makerere University School of Public Health Regulatory Ethics Committee and Uganda National Council of Science and Technology (UNCST) (REC Protocol number: SPH-2023-525) to conduct this secondary data analysis.
Data availability
The datasets used and/or analysed during the current study are available in the supplement files and are also publicly available at www.dhsprogram.com.
Funding
The authors received no specific funding for this work
Authorship contributions
DZ conceived, conceptualised, developed the study, obtained permission to use the data set from DHS program, conducted literature review, conducted analysis, interpreted results, prepared the tables and figures, drafted, and finalised the article. AA, LB, and AD were involved in designing the study, data analysis, interpreting results and substantially reviewed the article. MN and AK analysed the data and prepared the tables and figures. All co-authors contributed to the redrafting and finalising of the article.
Disclosure of interest
The authors completed the ICMJE Disclosure of Interest Form (available upon request from the corresponding author) and disclose no relevant interests.
Correspondence to:
Daniel Zaake
Department of Health Policy Planning and Management, School of Public Health, College of Health Sciences, Makerere University
Department of Obstetrics and Gynaecology, Mother Kevin Postgraduate School, Uganda Martyrs University Nkozi
Kampala,
Uganda.
Email: [email protected]