_by_treatment_.tif)


Tuberculosis remains a major public health problem globally, with an estimated 10.6 million new cases in 2021.1 The burden of paediatric tuberculosis is substantial, with the World Health Organization (WHO) estimating that, in 2021, about 1.2 million children under 15 years fell ill with tuberculosis worldwide, and approximately 200,000 died due to this disease.1
Children aged 0-4 years, or 5-14 years living with HIV, who live in the same household with an index tuberculosis patient are at an increased risk of progression to active tuberculosis disease once infected.2,3 Furthermore, these children are more prone to severe forms of the disease, such as tuberculosis meningitis, and have a higher risk of death than other age groups.3–6
The WHO recommends systematic screening for tuberculosis in household contacts of individuals diagnosed with tuberculosis and tuberculosis preventive treatment (TPT) initiation if eligible, with priority given to children under the age of 5 years and 5-14 years living with HIV.7 However, tuberculosis child contact management has not been routinely or effectively implemented in resource-limited settings due to multiple obstacles including healthcare system-related barriers such as infrastructure and human resources.3,8–11 Families also face several challenges in bringing children to the healthcare facility including, among other things, the burden of travel, financial challenges, and transport costs.10–12 These subsequently lead to parents’ reluctance to bring their children to the facility for tuberculosis screening. This limits case detection and attainment of the targeted TPT coverage rates.
Active contact investigation at the community and household level, a key element of the family-centred care concept, is considered a critical intervention for enhancing both case finding and provision of TPT among children and adolescents.7,13 Household or community-based interventions are likely to improve the uptake and acceptability of child contact screening and management as they remove some access barriers.14,15 In addition, they are likely to improve adherence to TPT and reduce costs and workload at the health facility level.
Evidence on the impact and cost-effectiveness of household or community-based contact investigation and management in resource-limited settings is urgently required.16 The economic impact of these interventions on households has not been investigated, with previous evaluations focusing on health system costs.17,18 While costs to patients are well recognised as important for patients on anti-tuberculosis treatment,1 they have not yet been considered much in relation to TPT. A recent study by Yuen et al.19 found that costs to patients had a sizable contribution towards the total costs of TPT provision. An understanding of these costs will help formulate policies and interventions that help to improve access to contact investigation and management leading to improved patient outcomes.
We evaluated the economic impact on households with children receiving TPT of community- and facility-based service-delivery models for contact investigation and TPT within the Community-based Tuberculosis Tracing and Preventive Therapy (CONTACT) multicentre, cluster-randomised trial in Cameroon and Uganda.
METHODS
Study design and setting
A cross-sectional survey with retrospective data collection and projections based on approaches adapted from the WHO Global taskforce on tuberculosis patient cost surveys20 was conducted between February 2021 and March 2021. The survey included caregivers (parents/guardians) of children enrolled in the CONTACT study. The CONTACT study [NCT03832023] was a pragmatic, multicentre, cluster-randomised controlled trial (cRCT) that evaluated the impact of child contact tuberculosis investigation and TPT management in Cameroon and Uganda. Cameroon and Uganda are high tuberculosis incidence, resource-limited (gross national income per capita of $3,990 in Cameroon and $2,360 in Uganda) sub-Saharan African countries with different programs for the delivery of tuberculosis services. Details of the CONTACT study procedures have previously been reported.21,22 In short, the intervention model included the screening of tuberculosis contacts by community health workers (CHWs), decentralised TPT initiation by a nurse, and follow-up at the community level by a trained CHW. Child contacts with symptoms suggestive of tuberculosis or with TPT side effects requiring further investigations were referred to a health facility where a clinician trained on study safety procedures assessed them. The control arm was the standard of care in each country with TPT initiation and follow-up done at the health facility. In both arms, child contacts eligible for TPT were given 3 months of isoniazid and rifampicin daily (3HR). The number of scheduled visits for TPT initiation and follow-up was 3 in the control and 5 in the intervention.
Study population
Caregivers of children registered for TPT already enrolled in the CONTACT study who had completed at least two weeks of treatment were eligible for the survey. Caregivers who provided written informed consent were invited to take part in the cost survey. Participants were consecutively invited to participate from the CONTACT study enrolment register.
Sample size
The sample size was calculated assuming catastrophic costs affect 50% of households in our recruited cohort (conservative from the perspective of power), a design effect for this quantity of 2 and an absolute precision of 20% resulting in a sample size of 48 households across the two countries.
Data collection
Data was collected using a standardised questionnaire adapted from the WHO Global task force on tuberculosis patient cost surveys.19 The questionnaire (previously published17 and available in Tables S2 and S3 in the Online Supplementary Document) was adapted to the local context (facility types, currencies, socio-economic questions) including translation to the French language in Cameroon. We incorporated previously published country-specific questions on household asset ownership and dwelling characteristics.23 The survey was done during the COVID-19 pandemic, so we also developed and included a set of questions to assess the impact of the pandemic on TPT care and the economic welfare of the households. Data were collected and managed using REDCap electronic data capture tools hosted at The University of Sheffield.24 The data collection instrument was piloted during the training of data collectors.
Trained data collectors conducted face-to-face interviews at the facility in the control or in the community as part of the home visits in the intervention arm of the CONTACT study. Enrolled caregivers were interviewed to gather information on expenditures and time losses (opportunity costs) experienced during seeking health care and caring for the children. Data on health care utilisation, household asset ownership, coping mechanisms (e.g. dissaving, borrowing, selling assets), and perceived social and financial impacts of TPT were collected. Participants also provided information on socio-economic characteristics (e.g., the income of the participant and of household), and COVID-19 impact. Clinical and demographic information of children included in the survey was extracted from the CONTACT study database before the interview.
Definitions (patient costs, income, catastrophic costs, coping measures)
We estimated direct medical, direct non-medical, and indirect costs incurred before and during TPT from a patient perspective. We collected data on direct medical costs (consultation fees, hospital admissions, medicines, laboratory tests), direct non-medical costs (transport and food), and indirect costs (opportunity costs representing lost productivity by a caregiver seeking and receiving care for their child or children) incurred up to the time of interview. The human capital approach was used to estimate the indirect costs by summing up the reported time lost due to receiving and waiting for care, hospitalisation, transportation, and lost working days for the caregiver to get an estimate of the total time lost. The total time lost was multiplied by the minimum hourly wage in each country.
To minimise recall bias, for households with more than one child on TPT, data were collected only for a single child contact and the TPT treatment month the child was in at the time of the interview. We estimated the entire treatment cost per month by extrapolating the costs incurred up to the time of the interview. Costs for the other months of TPT were estimated using the median reported costs collected from caregivers interviewed when their children were in that treatment month. We assumed that direct medical costs and some direct non-medical costs (e.g. accommodation, food and transport) would scale up with the number of contacts. In order to estimate the total costs due to TPT in the household, we multiplied estimated direct medical and non-medical costs in that household by the number of contacts screened (for costs incurred before TPT) and the number of children initiated on TPT (for costs incurred after TPT initiation).
Consistent with the global End TB indicator defined by the WHO,20 we estimated the proportion of households experiencing catastrophic total costs due to TPT as the proportion of households with total costs (direct and indirect costs) incurred exceeding 20% of the household’s annual income.
In addition, we assessed the potential impact of the COVID-19 pandemic on TPT care and economic welfare, the coping strategies used by households to deal with the cost associated with TPT and the social consequences experienced. We estimated the proportion of households employing each coping strategy, experiencing each social consequence and suffering each COVID-19 impact.
Data analysis
Descriptive statistics are reported for demographic characteristics, clinical characteristics, clinical outcomes, and patient costs for each country. Categorical variables are summarised using frequencies (with percentages) and continuous variables are summarised using the mean (with standard deviation, SD) or the median, (with interquartile range, IQR). Time lost and patient costs are summarised using a median with IQR due to skewed distributions. Costs are disaggregated into direct medical, direct non-medical, and indirect costs, and are presented for the period before and during TPT. Costs are also presented by the model of TPT delivery (facility-based versus community-based). The survey was not powered to compare costs across the models of TPT delivery hence no formal statistical tests were performed. Missing household income was imputed using a regression model based on household asset ownership and dwelling characteristics. The proportion of households experiencing catastrophic costs was adjusted for clustering effects using a logistic regression model with a binomial distribution and logit link function including the fixed effects of country and model of care. These proportions are presented as model-predicted means and 95% confidence intervals (CI). All costs and incomes were collected in local currency and converted to US dollars using the country-specific average exchange rate during the study period (February – March 2021) available from OANDA25 (US$1 to 550 Central African Franc in Cameroon and 3,666 Ugandan Shilling in Uganda).
Sensitivity analyses
The impact of different assumptions on total household costs and the incidence of catastrophic costs was evaluated in sensitivity analyses. In line with current guidance,20 we also used the output-based approach to calculate indirect costs by applying self-reported income to estimate income change before TPT and during TPT care. We present the incidence of catastrophic costs when only direct costs are counted (that is excluding lost income or a valuation of lost time), in a more conservative approach. Lastly, we varied the threshold for estimating the incidence of catastrophic costs to evaluate its impact on the proportion of households classified as facing catastrophic costs.
Ethical considerations
The patient cost survey was part of the CONTACT cRCT protocol that was approved by the WHO Ethics Research Committee, the Advarra Institutional Review Board, and local ethics committees from Cameroon and Uganda. All participants provided informed consent for participation in the CONTACT cRCT and provided informed assent before taking part in the interviews.
RESULTS
Survey participants
Caregivers representing 57 households in Cameroon (18 in the control and 39 in the intervention) and 47 households in Uganda (18 in the control, 29 in the intervention) were interviewed (Table 1). The mean age of children on TPT included in the survey was 2 years and 54% were male. The mean household size was 7 (SD=4.12) in Cameroon and 5 (SD=2.19) in Uganda. In both countries, the average number of household contacts per index case (3 contacts), initiated on TPT (2 child contacts), and on TPT follow-up at the time of the interview (2 child contacts) were similar. A few participants in Cameroon, 11% (6/57) and none in Uganda reported having health insurance coverage. The self-reported mean annual household income was lower in Uganda ($140) compared to Cameroon ($185). Household income was much higher for participants in the control in Cameroon ($314). Despite the differences in income, a similar proportion of households were living below the international poverty line of US$1.90 per day (~85%) in both countries. The majority of households in both countries were classified at or below the average national household income quintile estimated based on reported household asset ownership; 93% (53/57) in Cameroon and 55% (26/47) in Uganda.
Model of care
Eight children (14%) in Cameroon had previously been hospitalised in relation to TPT at the time of the interviews for a mean duration of stay of 0.5 days and none in Uganda (Table 2). In both countries, no children were hospitalised at the time of the interview. Lower mean health facility visits were reported as part of TPT initiation (0.3 visits in Cameroon and 0.1 visits in Uganda) than during TPT follow-up (2.05 visits in Cameroon and 4.5 visits in Uganda). The average total number of facility visits was higher in the control (7 visits in Cameroon and 11 visits in Uganda) compared to the intervention (0.3 visits in Cameroon and 0.1 visits in Uganda).
Main findings
Time loss for care-seeking
The reported mean total time loss for care-seeking for caregivers was 18.16 (SD=16.28) hours in Cameroon and 32.08 (SD=39.55) hours in Uganda (Table 2). The mean total time lost was higher in the control; 30.4 (SD=21.43) hours in Cameroon and 53.17 (SD=54.68) hours in Uganda compared to the intervention; 12.82 (SD=9.7) hours in Cameroon and 18.52 (SD=15.4) hours in Uganda. This was largely driven by time spent during treatment follow-up visits.
Estimated total costs
The overall median household costs estimated using the human capital approach were $10.91 (IQR; $2.73-54.79) in Cameroon and $11.64 (IQR; 3.03-41.55) in Uganda (Table 3 and Figure 1). The median costs were higher in the control ($62.96 [IQR; $19.78-239.74] in Cameroon and $35.95 [IQR; $29.03-91.26] in Uganda) compared to the intervention ($2.73 [IQR; $2.73-14.18] in Cameroon and $4.55 [IQR; $3.03-6.06] in Uganda). The overall costs were driven by indirect costs (60%), direct medical costs (29%), and direct non-medical costs (11%) in Cameroon and by indirect costs (63%), direct non-medical costs (28%), and direct medical costs (9%) in Uganda. In general, poor households (average national wealth quintile and below) were disproportionately affected financially by costs related to TPT, especially in Cameroon where a gradient of effect was observed (Figure 2). The ratio of total costs incurred to annual household income was relatively large for households in the lower wealth quintiles.
_by_treatment_.tif)

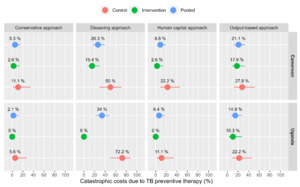
Using a threshold of 20% of annual household income and the human capital approach for valuing time loss, the estimated proportion of households facing catastrophic costs due to TPT was 6% (95%CI; 2-16%) in Cameroon and 5% (95%CI; 6-19%) in Uganda (Figure 3). Disaggregated by the model of TPT delivery, 15% (95%CI; 5-31%) of households in Cameroon and 14% (95%CI; 4-26%) in Uganda experienced catastrophic costs in the control compared to 3% (95%CI; 1- 8%) in Cameroon and 3% (95%CI; 1-8%) in Uganda in the intervention.

Coping strategies, social consequences and the impact of the COVID-19 pandemic
Approximately half of the households in the control; 53% (95%CI; 36-71%) in Cameroon and 50% (95%CI; 31-69%) in Uganda experienced dissavings (taking a loan, selling an asset, or use of savings) to deal with costs related to TPT (Figure 3 and Table 4). In the intervention, 18% (95%CI; 10-29%) in Cameroon and 17% (95%CI; 8-29%) in Uganda experienced dissavings. Approximately 30% (16/57) of participants in Cameroon and 34% (16/47) in Uganda reported that their household was now poorer or much poorer following TPT initiation for their children. A substantial number of households in Uganda 66% (31/47) reported experiencing some social consequences compared to 14% (8/57) in Cameroon. The COVID-19-related economic impact was reported by most of the households in both countries; 97% (55/57) in Cameroon and 100% (47/47) in Uganda. A small proportion of households reported experiencing COVID-19-related impact on care; 3.5% (2/57) in Cameroon and 6.4% (3/47) in Uganda.
Sensitivity analyses
Using the output-based approach to value time lost by caregivers seeking care for their children increased indirect costs, subsequently increasing total costs and the proportion of households experiencing catastrophic costs. The median household income loss (indirect cost) was ($0.00 [IQR; $0.00-266.13] in Cameroon and $40.98 [IQR; $16.39-184.43] in Uganda (Table S1 and Figure S1 in the Online Supplementary Document). This resulted in the pooled total median household costs of ($54.55 [IQR; $0.00-354.55] in Cameroon and $73.77 [IQR; $24.64-296.72] in Uganda. The median costs were higher in the control arm ($259.64 [IQR; $10.67-647.87] in Cameroon and $107.06 [IQR; $41.86-311.89] in Uganda) compared to the intervention arm ($25.09 [IQR; $0.00 -269.43] in Cameroon and $40.98 [IQR; $16.39 -245.90] in Uganda). The distribution of cost drivers when applying the output-based approach is shown in (Figure S1 in the Online Supplementary Document).
Using a threshold of 20% of household income and the output-based approach, the proportion of households facing catastrophic costs due to TPT was 17% (95%CI; 7-38%) in Cameroon and 16% (95%CI; 6-31%) in Uganda (Figure 3). In the disaggregated analysis, 38% (95%CI; 22-56%) of households in Cameroon and 35% (95%CI; 19-53%) in Uganda experienced catastrophic costs in the control arm compared to 11% (95%CI; 5-18%) in Cameroon and 10% (95%CI; 4-17%) in Uganda in the intervention. The proportion of households experiencing catastrophic costs using the human capital approach ranged from 2-12% in Cameroon and 0-11% in Uganda when the threshold for catastrophic costs varied from 10 – 60% (Figure 4). Under the output-based approach, the proportion of households facing catastrophic costs ranged from 2-37% in Cameroon and 0-15% in Uganda.

DISCUSSION
This study demonstrated that households with child tuberculosis contacts evaluated for and initiated on TPT incur some considerable economic costs and can experience catastrophic costs and dissavings. Although the absolute values of these costs seem rather low, some households experienced catastrophic costs. Households included in this study were already impoverished with the majority (80%) living under the international poverty datum line, making them especially vulnerable to even small shocks to their household income able to push them further into poverty. These findings have wider implications for these families who may have had other expenditures related to the index tuberculosis patient or other tuberculosis patients in the same household.
The estimated costs were consistently lower in the intervention suggesting the potential impact of community-based interventions in reducing patient costs in these settings. The intervention implemented in the CONTACT study helped to reduce these costs by eliminating transportation and food costs associated with visits to healthcare facilities during TPT. A reduction or complete elimination of patient costs, previously described as a likely access barrier to care,10,26 has the potential to improve TPT initiation, adherence, and completion. Although the intervention led to considerable cost reductions, these were not enough to completely eliminate catastrophic expenditures, suggesting that additional effort is required to refine the current models of TPT delivery and social support. Current evidence suggests that providing socio-economic support for households affected by TB is likely to improve TPT outcomes. A randomised controlled study from Peru27 for an intervention providing socio-economic support increased tuberculosis preventive therapy initiation (adjusted odds ratio, aOR: 2.2; 95%CI: 1.1–4.1) and completion (unadjusted OR: 1.6; 95%CI: 1.0–2.6) among contacts younger than 20 years. Socio-economic interventions were associated with increases in preventive therapy initiation (from 39% to 88%); and preventive therapy completion (from 27% to 87%) in a pre- and post-study among contacts younger than 20 years in Peru.28
Although costs to patients have previously been described as a likely barrier to accessing care, studies estimating patient or household costs associated with TPT provision are limited. We found only one study that included the costs to patients receiving tuberculosis preventive treatment which found that a considerable proportion of the total costs of TPT provision is incurred by patients.19 On the contrary, several studies for patients on anti-tuberculosis treatment have consistently demonstrated that patients incur high costs and a high proportion of patients experience catastrophic costs.1 Results from 27 national surveys on costs faced by patients on anti-tuberculosis treatment and their families showed that the percentage facing catastrophic costs ranged from 13% to 92% and the pooled average, weighted for each country’s number of notified cases, was 48% (95%CI: 36–61%).1 In the context of our study countries, the percentage of patients on anti-tuberculosis treatment and their families facing catastrophic costs was 53% (95%CI: 43–63%) in the Uganda national survey.29 The results of the national survey in Cameroon are yet to be published.
Like households with patients on anti-tuberculosis treatment, households with children receiving TPT incur direct medical costs despite the provision of “free tuberculosis care” services in these settings. Although tuberculosis services are provided free of charge in these settings, some patients may still pay out-of-pocket expenses for medical care. In our study, these were mainly incurred before TPT initiation (to rule out active tuberculosis disease) and included consultation fees, investigations and medicines. Direct medical costs in the control arm contributed 37% and 19% of the total costs in Cameroon and Uganda, respectively. This contribution was reduced in the intervention arm to 24% and 2% of the total costs in Cameroon and Uganda, respectively. The higher percentage observed in Cameroon resulted from 4 children who had been hospitalised and the generally higher costs reported for medical costs before TPT and during TPT follow-up visits. These findings further highlight the need for policies aiming to reduce direct medical costs (for example consultations, medicines, and laboratory fees) associated with accessing tuberculosis care services.
Direct non-medical costs on transportation, food, and nutritional supplements account for a substantial share of the total costs for patients on anti-tuberculosis treatment (51-80% in some countries).1 In our study, non-medical costs accounted for 32% and 55% of the total costs in the control arm in Cameroon and Uganda, respectively. These were substantially reduced to 1% and 11% in the intervention in Cameroon and Uganda, respectively. The higher contribution of non-medical costs in Uganda is likely a reflection of the increased transportation costs associated with sustained COVID-19 restrictions implemented. Unlike most surveys for patients on anti-tuberculosis treatment which reported indirect costs (income loss) accounting for a huge proportion of total costs (ranging from 44-77%),1 the contribution of indirect costs in our study was fairly moderate (below 30% in the control arm and only increasing to larger than 70% in the intervention due to a reduction in the contribution of direct medical and non-medical costs). The differences in the proportional contribution of indirect costs (income loss) are potentially due to differences in treatment duration as well as methodological differences in their valuation. The longer treatment periods associated with anti-tuberculosis treatment result in higher time and income losses. In contrast, shorter TPT regimens are now in use and all the children in our study were treated for 3 months only, leading to lower indirect costs. We also used the human capital approach, a conservative approach to valuing time loss, resulting in the low to moderate indirect costs we found.
Our study has a number of potential limitations that warrant discussion. All cost data were based on a cross-section design, self-reporting, extrapolation and imputation of costs, all of which are subject to potential biases. The interviews were restricted to a single child and the current month of TPT to reduce recall bias. Extrapolating costs for all child contacts in the household based on data collected for a single child contact assumes a similar resource use pattern and is likely to overestimate costs. However, this risk was reduced in part by restricting the extrapolation to cost categories that are likely to scale with the volume of child contacts (medical and non-medical). The methodology we used only estimated the costs associated with the current month of TPT therapy. Costs may be different depending on the month of therapy and thus this approach may have led to some over- or under-estimation of costs. However, the authors felt that this was a reasonable trade-off in order to decrease the risk of recall bias. Incorporating longitudinal designs30–32 and auditing receipts for payments in future studies could potentially reduce the impact of these possible biases. Longitudinal survey designs require additional time and resources hence the cross-sectional approach remains a more feasible option for most settings.30
The small sample size limited the precision of our estimates, but we feel this does not undermine the usefulness of the results. Our preliminary estimates provide scope for additional studies that may help to further confirm these findings. Our analysis used self-reported income as a measure of living standard in the denominator for estimating the incidence of catastrophic costs, which is hard to measure reliably in settings with large informal sectors as in the two countries where our study was done. To assess the impact of this choice, we also assessed income losses using the output-based approach in the sensitivity analysis resulting in increases in costs and incidence of catastrophic costs.
In our analysis, it was not possible to disentangle the possible impacts of COVID-19 on healthcare seeking, household income, and income losses. Although data collection for this survey did not coincide with the COVID-19 pandemic-related lockdowns (27 March 2020 to 28 August 2020 in Cameroon and 18 June 2021 to 3 August 2021 in Uganda), the pandemic could have impacted healthcare-seeking and household income in ways we were not able to quantify in this study. In particular, transport costs were increased due to the reduction of passengers per transport imposed by the restrictive measures. It was also not possible to isolate the effects of the index tuberculosis patients and/or multiple concurrent tuberculosis illnesses in the same household on household income and income losses. In light of these challenges, our primary analysis used the human capital approach to value the reported time spent by caregivers seeking and receiving care for their children. This approach does not value productivity losses associated with the care-seeking process which has previously been reported to be substantial in the context of anti-tuberculosis treatment.1 Therefore, the cost estimates in our primary analysis are conservative. However, this approach has the added advantage of addressing equity issues around time loss valuation using individual income information.33
We also evaluated coping behaviors which we also used as an indicator of catastrophic costs. Our findings were consistent with the primary analysis in showing that a substantial proportion of households experienced catastrophic costs, although this was more pronounced when using the output-based and dissavings approaches. These could reflect the interaction between the effects of the COVID-19 pandemic and single/multiple concurrent tuberculosis illnesses in the household. Ideally, costs associated with the provision of TPT should not be considered in isolation as these other variables may have far much wider impacts on household wealth, income losses and dissavings. Future studies could evaluate household costs associated with both anti-tuberculosis treatment and TPT in the same household to get the full impact.
CONCLUSIONS
Consistent with findings from national tuberculosis patient surveys, households with child contacts initiated on TPT incur considerable costs, despite the notion of ‘free tuberculosis services’. Although the community-based interventions helped to reduce these costs, particularly for follow-up visits at the facility, transportation, and food, these were not enough to eliminate catastrophic costs. These findings suggest the urgent need for policies that eliminate patient costs associated with tuberculosis disease. Policies that optimise models of care and provide socio-economic support to tuberculosis-affected families alongside healthcare care services are urgently required and are likely to improve patient access to health facilities, case detection, TPT coverage and outcomes.
Acknowledgements
We thank the parents/guardians of the children included in this study for spending their time to respond to the survey questions, the CONTACT study research assistants for diligently collecting the data, and the CONTACT study group for their support and collaboration on this study. We are very grateful to the Ministries of Health and National TB programs in the project countries for the support provided to the CaP-TB project and the CONTACT study. We also acknowledge WHO for providing an example R code that was used for the analysis.
Ethics statement
The patient cost survey was part of the CONTACT cRCT protocol that was approved by the WHO Ethics Research Committee, the Advarra Institutional Review Board, and local ethics committees from Cameroon and Uganda. All participants provided informed consent for participation in the CONTACT cRCT and provided informed assent before taking part in the interviews.
Data availability
Deidentified data collected for the study can be made available upon reasonable request after manuscript publication.
Funding
The CONTACT study and investigators were supported by Unitaid (2017-20-EGPAF-CAP-TB). PJD was supported by a fellowship from the UK Medical Research Council (MR/P022081/1); this UK funded award is part of the EDCTP2 programme supported by the European Union.
Authorship contributions
MB, BT, DA, and PJD designed the study and wrote the study protocol. NM, SM, and PJD designed and performed the data collection and quantitative analyses. NM, SM, BT, DA, BTY, BS, RO, SL, JC, AV, MC, MB, PJD, and the CONTACT study group contributed to the study design and reviewed the protocol. NM and PJD drafted the manuscript. NM and PJD had full access to all the data in the study and had final responsibility for the decision to submit for publication. All authors have read and approved the final version of the manuscript.
Disclosure of interest
The authors completed the ICMJE Disclosure of Interest Form (available upon request from the corresponding author) and disclose no relevant interests.
Additional material
Included as Online Supplementary Document.
Correspondence to:
Dr Nyashadzadzaishe Mafirakureva
Sheffield Centre for Health and Related Research (SCHARR)
Division of Population Health
School of Medicine and Population Health
University of Sheffield
30 Regent Street
Sheffield
[email protected]