_by_treatment_.tiff)
_by_the_level_.tiff)


Tuberculosis (TB) patients and their households often incur large costs related to illness, seeking and receiving healthcare services.1,2 Such costs create access3 and adherence4 barriers which affect health outcomes and increase the risk of transmission of the disease.5,6 TB disproportionately affects those in the lowest wealth quintiles,7 and costs due to seeking and receiving TB care can further impoverish the poorest households.
Ensuring that no TB patient or their household face “catastrophic total costs” due to TB by 2025 is one of the three targets for the World Health Organisation (WHO) End TB Strategy.8 Assessing the composition and magnitude of these costs through periodic health facility-based surveys is now recommended for monitoring progress towards achieving this target.9
The WHO Global TB Programme developed standardised methodology and published guidance on implementing TB patient cost surveys used to quantify costs faced by TB patients and their households. Currently, 29 national TB patient cost surveys have been completed with 27 reporting the results (including Kenya).10 The pooled average percentage of households facing catastrophic costs (defined as >20% of annual household income) from these national surveys was 48% (95% confidence interval (CI): 36–61%).10
Despite the growing body of evidence on costs incurred by TB patients, to our knowledge, limited attempts have so far been made to focus on the economic impact on households seeking care for children sick with TB. The SARS-CoV-2 2019 pandemic (COVID-19) caused severe, widespread disruptions to TB diagnosis, care and prevention services,11,12 making these targets less likely to be reached. The impact of the COVID-19 pandemic on household costs has not been widely assessed. Limited evidence showed that the COVID-19 pandemic was associated with significant income loss13–15 and increased risk of experiencing catastrophic costs13 among patients with TB.
We evaluated the costs faced by households with children seeking and receiving TB services (defined as screening, diagnosis and treatment of drug-sensitive TB) for children during the Catalyzing Pediatric TB Innovations (CaP-TB) project in Cameroon and Kenya. This evaluation was performed during the COVID-19 pandemic, which potentially also impacted these households.
METHODS
Study design and setting
A cross-sectional facility-based survey with retrospective data collection, based on approaches developed by the WHO Global taskforce on TB patient cost surveys, was conducted between November 2020 and June 2021. The survey was done alongside the Integrating Paediatric TB Services Into Child Healthcare Services in Africa (INPUT) study (NCT03862261), a stepped-wedge cluster-randomised (SW-CRT) intervention study which assessed the effectiveness of integrating TB services into child healthcare services on TB diagnosis capacities in children under 5 years of age. Details of the INPUT study have previously been reported.16 In short, the INPUT study was undertaken in Cameroon and Kenya to compare the CaP-TB package of interventions against the standard of care for TB diagnosis. The standard of care followed the national guidelines for the delivery of paediatric TB services. The intervention was implemented at both the hospital and primary healthcare levels and included a package of training, supportive supervision, job aids, and logistical support for the integration of TB screening and diagnostic activities into healthcare entry points for children (outpatient departments, inpatient departments, maternal and child health, nutrition, and HIV services).
Study population
Caregivers (parents/guardians) with children enrolled in the INPUT study who had completed at least two weeks of treatment were eligible for the costs survey. Caregivers who provided written informed consent were invited to take part in the cost survey. Participants were identified and consecutively enrolled from the INPUT study register.
Sample size
The sample size was calculated assuming catastrophic costs affect 50% of households in the cohort (conservative from the perspective of power), and the design effect of 2, resulting in a sample size of 75 households per country to obtain an absolute precision of 10%. For logistical and budgetary reasons, the sample size was revised to 48 across the two countries using a 20% precision still within the range of 20% to 40% suggested for national surveys of catastrophic costs among TB patients by WHO.9
Data collection
A standardised questionnaire adapted from the WHO Global taskforce on TB patient costs9 was used to collect data. The questionnaire (previously published17 and available in Tables S2 and S3 in the Online Supplementary Document) was adapted to the local context (facility types, currencies, and socio-economic questions) including translation to the French language in Cameroon. We incorporated previously published country-specific questions on household asset ownership and dwelling characteristics.13 We also developed and included a set of questions to assess the potential impact of the COVID-19 pandemic on TB care and economic welfare of households. Data on TB patient costs were collected and managed using REDCap (Research Electronic Data Capture) electronic data capture tools hosted at The University of Sheffield.18 The data collection instrument was piloted during the training of research assistants in each country.
Trained research assistants conducted face-to-face interviews with caregivers at the facility during treatment follow-up visits for children. Enrolled caregivers were interviewed to gather information on expenditures and time losses (opportunity costs) experienced towards seeking healthcare and caring for their children. Data on healthcare utilisation, household asset ownership, coping mechanisms (e.g. dissaving, borrowing, or selling assets), and perceived social and financial impacts of TB care were collected. Participants also provided information on socio-economic characteristics (e.g., the income of the caregiver and household), and COVID-19 impact. Clinical and demographic information of children was extracted from the INPUT study database before the interviews.
Definitions (patient costs, income, catastrophic costs, coping measures)
All costs incurred before and during TB treatment were collected and estimated from a patient perspective. Data was collected on direct medical (consultation fees, hospital admissions, medicines, laboratory tests) and non-medical (e.g., transport and food) costs, net of reimbursement, and indirect costs (opportunity cost – representing lost productivity by a caregiver seeking and receiving care for their child or children), up to the time of interview. The human capital approach was used to value time lost in the primary analysis, by summing up the reported time lost by caregivers due to receiving and waiting for care, hospitalisation, transportation, and lost working days for the caregiver to get an estimate of the total time lost. The total time lost was multiplied by the minimum hourly wage in each country to estimate the cost of lost time.
To minimise recall bias, data were collected only for the current TB treatment phase the child was in at the time of the interview. We estimated the entire treatment costs per TB treatment phase by extrapolating the costs incurred up to the time of the interview. Total patient costs for the entire duration of TB treatment were estimated based on median cost data collected from caregivers interviewed when their own children were in the other phase of TB treatment. In summary, the costs and time lost information for participants interviewed in the intensive phase were used to project intensive phase costs for those interviewed in the continuation phase and vice-versa.
Consistent with the global End TB Strategy indicator,9 we estimated the proportion of households experiencing catastrophic total costs due to TB, defined as the proportion of households with total costs (direct and indirect costs) incurred exceeding 20% of the household’s annual income.
We also assessed coping strategies used by households to deal with the cost of TB treatment, the social consequences of TB disease and treatment and the socio-economic impact of the COVID-19 pandemic. We estimated the proportion of households employing each coping strategy, experiencing each social consequence and experiencing each COVID-19 impact.
Data analysis
Descriptive statistics are reported for demographic characteristics, clinical characteristics, clinical outcomes, and patient costs. Categorical variables are summarised using frequencies (with percentages) and continuous variables are summarised using the mean and standard deviation or the median, (with interquartile range, IQR). Time lost and patient costs are summarised using a median with IQR due to skewed distributions. Proportions of households experiencing catastrophic costs are presented as means and 95% Binomial confidence intervals (CI). Costs are disaggregated into direct medical, direct non-medical, and indirect costs, and are presented for the period before TB diagnosis and during TB treatment. Missing household income was imputed using a regression model based on household asset ownership and dwelling characteristics. All costs and incomes were collected in local currency and were converted to US dollars using the country-specific average exchange rate during the study period (November 2020 – June 2021) available from OANDA19 (US$1 to 550 Central African Franc in Cameroon and 108 Kenyan Shilling in Kenya).
Sensitivity analyses
We evaluated the impact of different assumptions on total household costs and occurrence of catastrophic costs. Consistent with current guidance on TB patient cost surveys,9 we used the output-based approach to estimate indirect costs in terms of income change before and after TB diagnosis. We present the proportion of households experiencing catastrophic costs when indirect costs are measured based on the output approach. The incidence of catastrophic costs was also calculated by considering direct costs only (that is excluding lost income or a valuation of lost time), in what we term our conservative approach. Lastly, we varied the threshold for calculating catastrophic costs to evaluate its impact on the proportion of households facing catastrophic costs due to TB disease.
Ethical considerations
The patient cost survey was part of the INPUT SW-CRT protocol that was approved by the WHO Ethics Research Committee, the Advarra Institutional Review Board, and local ethics committees from Cameroon and Kenya. All participants provided informed consent for participation in the SW-CRT, which included specific information on the patient cost survey. They additionally gave assent before taking part in the interviews.
RESULTS
Survey participants
Caregivers representing 56 households (Cameroon, 26 and Kenya, 30) were interviewed (Table 1). Most children of caregivers included in the survey (80.4%) were receiving TB services at the hospital level (84.6% in Cameroon and 76.7% in Kenya). The rest of the children were receiving care at the primary healthcare level. The mean age of children on TB treatment was 1.8 years in Cameroon and 1.4 years in Kenya. Half (50%) of the children were female and 16% (34/56) were living with HIV. The mean duration from the onset of symptoms to anti-TB treatment initiation was 3.22 (SD=2.34) weeks in Cameroon and 4 (SD=2.68) weeks in Kenya. All children were on first-line anti-TB treatment, and 41/56 (73.2%) were in the intensive phase of treatment at the time of the interviews. The reported average household size was 6.3 (standard deviation (SD)=2.8) persons in Cameroon and 5.5 (SD=2.5) persons in Kenya. Self-reported mean monthly household income was lower in Kenya ($41) compared to Cameroon ($151). After assigning a national wealth quintile to each of our survey respondents using asset ownership information, a disproportionately large percentage of households (>70%) fell in the lowest two quintiles indicating that the survey populations in both countries were relatively poor compared to the general population. The proportion of households living below the international poverty line of US$1.90 per day was 92% in Cameroon and 100% in Kenya.
Model of care
The number of children reported to have previously been hospitalised in relation to TB was 4/26 (15.4%) in Cameroon and 5/30 (16.7%) in Kenya (Table 2). Only one child (3.3%) was hospitalised at the time of the interview in Kenya. Health facility visits were similar before TB diagnosis (~2 visits in both countries) and slightly higher in Kenya (17 visits in Kenya versus 14 visits in Cameroon) during TB treatment follow-up. The mean number of days spent in hospital was higher in Cameroon, 17.9 days, compared to Kenya, 4.2 days. The estimated number of TB treatment follow-up visits was 9 and 10 times higher than visits before treatment initiation in Cameroon and Kenya, respectively. The average total number of visits was higher in Kenya, 19 (SD=12) days, compared to Cameroon, 15 (SD=9) days.
Main findings
Time loss for care-seeking
The mean total time loss for care seeking for caregivers was 64.6 (SD=81.5) hours in Cameroon and 53.3 (SD=46.7) hours in Kenya. This was largely driven by time spent during treatment follow-up visits (~50%).
Estimated total costs
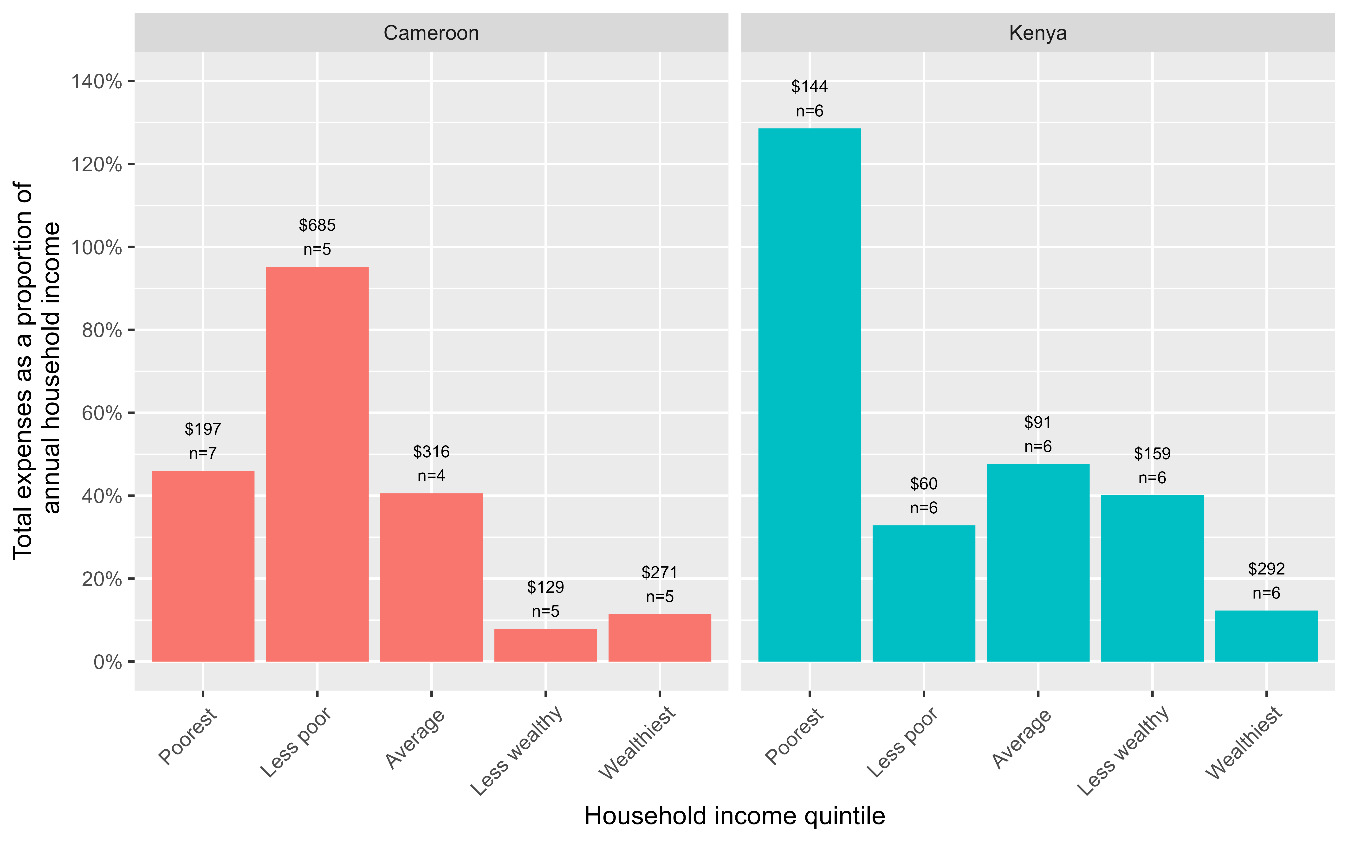
Using the human capital approach, the median household costs were $254.61 (IQR; $129.68-631.42) in Cameroon and $120.04 (IQR; $65.08-235.62) in Kenya. The main cost drivers were direct non-medical costs (transportation and food) contributing 52-54%, direct medical costs (consultation fees, hospital admissions, medicines, laboratory tests) contributing 26-36%, and indirect costs (caregiver time lost) contributing 12-21%. The distribution of costs across different cost categories is shown in Table 3 and Figure 1. Total cost before anti-TB treatment accounted for 57% of total costs in Cameroon [$144.15 (IQR; $1.36-343.41)] and 7% of total costs in Kenya [$7.15 (IQR; $0.00-25.87)]. The higher costs observed during anti-TB in Kenya were largely driven by the cost of nutritional supplements [$34.17 (IQR; $0.00-92.93)], contributing 91%. Poor households were disproportionately affected by costs associated with TB (Figure 3); in general, they experienced higher costs relative to their annual household incomes (>40% of household income). Using a threshold of 20% of annual household income, 50% (95%CI; 37-63%) of households experienced catastrophic costs (defined as total costs exceeding 20% of annual household income) globally (46% (95%CI; 29-65%) in Cameroon and 53% (95%CI; 36-70%) in Kenya).
_by_treatment_.tiff)
_by_the_level_.tiff)
Coping strategies, social consequences and the impact of the COVID-19 pandemic
The proportions of households experiencing any dissaving (taking a loan, selling an asset, or use of savings) to cope with TB-related expenses were 46% (12/26) in Cameroon and 47% (14/30) in Kenya (Figure 4 and Table 4). Most households in Cameroon reported some financial impact of TB in Cameroon (80.8%), compared to 43.3% in Kenya. A substantial number of households, 62.5% (76.9% in Cameroon and 50.0% in Kenya) reported experiencing some social consequences of TB disease and treatment (food security, social exclusion, children dropping out of school and potential loss of earnings). The COVID-19-related economic impact was reported by 76.9% of households in Cameroon and 33.3% in Kenya. Only one household in Kenya reported experiencing COVID-19-related impact on care.

Sensitivity analyses
The median estimated household income loss (indirect cost) was $0.00 (IQR; $0.00-218.34) in Cameroon (affecting 46.2% of households) and $105.62 (IQR; $0.00-255.13) in Kenya (affecting 66.6% of households) (Table S1 in the Online Supplementary Document). The distribution of costs across different cost categories when applying the output-based approach is shown in (Figure S1 in the Online Supplementary Document). Using the output-based approach changed the distribution of the main cost drivers to 41-44% direct non-medical costs, 30-34% indirect costs, and 22-30% direct medical costs.
The proportion of households facing catastrophic costs due to TB treatment estimated using the output-based approach at a threshold of 20% of annual household income was 58% (95%CI; 39-74%) in Cameroon and 83% (95%CI; 65-93%) in Kenya. A substantial proportion of households, 38-43%, still experienced catastrophic costs under the most conservative approach which excluded indirect costs from the computation of total costs. The proportion of households experiencing catastrophic costs estimated using the human capital approach ranged from 19-62% in Cameroon and 23-93% in Kenya when the threshold for estimating catastrophic costs varied from 10-60% (Figure 4). Under the output-based approach, the incidence of catastrophic costs ranged from 19-81% in Cameroon and 47-93% in Kenya.

DISCUSSION
We found consistent evidence showing that TB disease in children is associated with large household costs often leading to households experiencing catastrophic costs and dissavings, despite the availability of free TB services in these settings. Most of these ‘free services’ will only become available after a TB diagnosis has been established. The proportion of households experiencing catastrophic costs due to TB disease in their children was consistently high using various estimation approaches, including the most conservative approach which excluded indirect costs.
The high proportion of households experiencing catastrophic costs is largely due to the fact that the majority of households (>70%) in the survey were already poor relative to the general population resulting in any expenditures likely having a huge impact on their financial status. Most households lived under the international poverty line of US$1.90 per day.20 The poorest households within this survey disproportionately experienced both high absolute and relative costs further highlighting the substantial economic burden caused by TB in these households. These households, already very poor, are likely to be pushed further into poverty due to the increased costs associated with TB disease in their children.
These findings highlight the urgent need for social protection measures to reduce the impact and avoid further impoverishment of families due to TB disease. These have previously been shown to reduce costs and the occurrence of catastrophic costs.21 Most children (80.4%) in our study received TB services at the district or sub-district hospital level, therefore the costs we observed reflect mostly what is incurred at a higher level of care. In general, we observed higher costs in children receiving TB services at the district hospital level compared to the primary healthcare level (Figure 2). Community-based active case-finding interventions and decentralisation of services, in addition to improving case-finding, may substantially reduce medical, and non-medical costs (travel costs, medicines, and user fees especially in private facilities that patients may access) and indirect costs (time loss),22–25 which we found to contribute substantially to total costs.
Several other studies on TB patient costs have demonstrated high costs and high proportions of patients experiencing catastrophic costs. The pooled average percentage of drug-susceptible TB patients and their families facing catastrophic costs from 23 national surveys that reported disaggregated data, weighted for each country’s number of notified cases, was 47% (95%CI: 35–59%).10 This percentage was estimated to be 26% (95%CI: 20-32%) in the 2017 Kenya national survey.26 The prevalence of catastrophic costs was higher for patients with drug-resistant TB, 87% (95%CI: 80–93%).10 Results of the national survey in Cameroon are yet to be published. We found higher proportions of households experiencing catastrophic costs, 46% (95%CI: 29–65%) in Cameroon and 53% (95%CI: 36–70%) in Kenya using the human capital approach. These increased to 58% (95%CI: 39–74%) in Cameroon and 83% (95%CI: 69–93%) in Kenya when using the output-based approach to value time loss, further suggesting that the economic burden resulting from TB disease could be more substantial. As previously reported, it is also likely that some of this impact was accentuated by the COVID-19 pandemic.13–15 This highlights the need for further research to fully understand and isolate these effects.
The distribution of cost drivers in our main analysis (largely direct medical and non-medical costs) differs from what is widely reported in other studies (largely indirect and direct non-medical costs). In our study, more than half of the costs were direct non-medical costs arising from the costs of travel and nutritional supplements. These differences are potentially a direct reflection of the different methodological approaches used across studies as well as patient ages. We valued caregiver time using the human capital approach, resulting in the low to moderate indirect costs we found hence the lower contribution to total costs. Since our study focused on children under 5 years of age, we assumed no productivity losses for their time spent seeking care. On the contrary, the national surveys used a mix of children and adults who would incur productivity losses, and some of these surveys used the output-based approach to value time loss, resulting in higher estimates of indirect costs. This highlights the importance of studying different patient groups and exploring different methodological approaches in order to optimise interventions for reducing TB patient costs.
Consistent with previous surveys, our study showed that households with children receiving anti-TB treatment incur substantial direct medical costs, contributing 26-36% of total costs, despite the offer of free services. These medical costs were higher before TB diagnosis and included hospital admission fees, consultation fees, medicines costs and laboratory tests that were not directly linked to TB management and therefore, were not free. This further highlights the need for patient-centred models of care such as community-based active case-finding interventions and decentralisation of services that can reduce the financial burden associated with prolonged care-seeking before TB diagnosis.22–25 In addition, scaling up TB preventive therapy is required to reduce the risk of developing TB disease and hence avoid the associated financial burden. Our parallel study evaluating the costs incurred under community- and facility-based service-delivery models of tuberculosis preventive therapy for children showed that households with child TB contacts evaluated for and initiated on TB preventive therapy incur costs that exceed 20% of annual household income, however, these are substantially lower compared to children on anti-TB treatment. Although these estimates are not directly comparable, this favours investing in preventive therapy to reduce TB disease and the associated patient costs.
Our study draws major strength from a sole focus on a marginalised group of children under the age of 5 years. Previous surveys from sub-Saharan Africa that provided data on age disaggregation included only a small proportion of children under the age of 15 years, ranging from 5-13%.26–30 Understanding the costs and financial impacts for families with children on anti-TB treatment is important for informing the design of child-specific interventions. As with many surveys using a similar design, the estimates presented in this study are subject to recall bias because all cost data were self-reported by the caregivers of children on anti-TB treatment. However, this was minimised by asking questions relating to the treatment phase their child was in at the time of the interview with projections for missing data. The small sample size may have limited the precision of our estimates, however, we feel this does not undermine the potential usefulness of these results. These preliminary estimates provide scope for additional studies that may help to further confirm these findings. We used self-reported income as a measure of living standard in the denominator for estimating the proportion of households experiencing catastrophic costs, but it is well known that this is hard to measure reliably in settings with large informal sectors as in the two countries where our study was done. Our survey was performed during the COVID-19 pandemic; both countries implemented health and lockdown policies. These could have impacted healthcare-seeking, household income, and income losses.13–15,31 Our limited qualitative assessment of the potential impact of COVID-19 suggests a low impact on access to healthcare and a large economic impact on households with more than half affected in one way or another.
Data on other members of the household who may have had TB during the same period was not available. Therefore, it was also not possible to isolate the effects of concurrent TB illnesses in the same household on income and income losses. Our primary analysis used the human capital approach to value the reported time spent by caregivers seeking and receiving care for their children in an attempt to minimise the impact of these limitations. This approach does not value productivity losses associated with the care-seeking process which has previously been reported to be substantial in previous surveys,10 making the cost estimates in our primary analysis conservative. However, the human capital approach addresses potential equity issues around time loss valuation when using individual income information.28 We evaluated the impact of using the output-based approach and coping behaviors as an indicator of catastrophic costs in the sensitivity analysis finding consistent results showing that a substantial proportion of households experienced catastrophic costs.
CONCLUSIONS
Accessing and receiving TB services for children results in high levels of cost to households, even with free national health services. Decentralisation of health service provision and social protection strategies to reduce or mitigate costs to households of children accessing TB services should be explored.
Acknowledgements
We thank the caregivers (parents/guardians) of the children included in this study for spending their time to respond to the survey questions, the INPUT study research assistants for diligently collecting the data, and the INPUT study group for their support and collaboration on this study. We are very grateful to the Ministries of Health and National TB programs in the project countries for the support provided to the CaP-TB project and the INPUT study. We also acknowledge WHO for providing an example R code that was used for the analysis.
Ethics statement
The patient cost survey was part of the INPUT SW-CRT protocol that was approved by the WHO Ethics Research Committee, the Advarra Institutional Review Board, and local ethics committees from Cameroon and Kenya. All participants provided informed consent for participation in the SW-CRT, which included specific information on the patient cost survey. They additionally gave assent before taking part in the interviews.
Data availability
Deidentified data collected for the study can be made available upon reasonable request after manuscript publication.
Funding
The INPUT study and investigators were supported by Unitaid (2017-20-EGPAF-CAP-TB). PJD was supported by a fellowship from the UK Medical Research Council (MR/P022081/1); this UK-funded award is part of the EDCTP2 programme supported by the European Union.
Authorship contributions
LDN, AT, BT, ROM, and PJD designed the study and wrote the study protocol. NM, SM, LDN, ROM, BT, MAO, SS, SJP, PT, MC, AT, PJD, and the INPUT study group contributed to the study design and reviewed the protocol. NM, SM, and PJD designed and performed the data collection and quantitative analyses. NM and PJD drafted the manuscript. NM and PJD had full access to all the data in the study and had final responsibility for the decision to submit for publication. All authors have read and approved the final version of the manuscript.
Disclosure of interest
The authors completed the ICMJE Disclosure of Interest Form (available upon request from the corresponding author) and disclose no relevant interests.
Additional material
Included as Online Supplementary Document.
Correspondence to:
Dr Nyashadzadzaishe Mafirakureva
Sheffield Centre for Health and Related Research (SCHARR)
Division of Population Health
School of Medicine and Population Health
University of Sheffield
30 Regent Street
Sheffield
[email protected]