Since the early 1990s, the burden of being overweight and obese to morbidity and mortality in low- and middle-income countries (LMICs) is increasing more than that contributed by underweight.1 Globally, adult obesity doubled between 1980 to 2014, and the burden is higher among women (40%) compared to men (38%).2 Obesity is causally linked to all major non-communicable diseases (NCDs), including type 2 diabetes mellitus, hypertension, cardiovascular disease and some types of cancer.3 In 2022, the World Health Organization (WHO) estimated that over three-quarters of global deaths were attributed to NCDs and most were in LMICs.4 While obesity is not explicitly mentioned in the Sustainable Development Goals (SDGs), there are opportunities to develop actions against obesity under 13 of the 17 SDGs,5 particularly under target 3.4, to reduce premature mortality from NCDs by one-third through prevention, treatment, promotion of mental health and well-being.
The increasing prevalence of obesity among adults globally has specific consequences for women of reproductive age, especially those planning to be or are currently pregnant. Being overweight or obese in the pre-pregnancy period poses an increased risk for subfertility or infertility6 and adverse maternal and perinatal outcomes. For example, among Danish, Chilean and Chinese women, higher pre-pregnancy body mass index (BMI) was associated with higher odds of gestational diabetes, preeclampsia and operative delivery. Among newborns, there was a higher risk for macrosomia, birth injuries, stillbirth and pre-term birth.7,8 These adverse associations persist beyond the neonatal period and could affect children’s neuro-developmental milestones9 and increase their risk for adult onset of cardiovascular diseases10 and type 2 diabetes mellitus.11
Structural determinants for being overweight and obese among women of reproductive age include socio-economic factors such as lower wealth and lack of health insurance coverage.12 Irrespective of the country’s development level, women of older age and higher parity have higher odds of being overweight and obese.13 Among women in high-income countries, being married,14 lower education levels, smoking and having a lower-income job are factors that increase the risk of high pre-pregnancy BMI.15 In LMICs, being wealthier, living in urban areas, and achieving higher education levels were associated with a higher risk of being overweight or obese.16
Maternal mortality ratio (MMR) in Tanzania was estimated at 238/100,000 livebirths in 2020.17 Even though this represents a decline from 524/100,000 livebirths in 2015, it is still high, suggesting that the SDG of reducing MMR to less than 140/100,000 livebirths might not be attained by 2030.18 Recently, over half of global avertable adult mortality is due to NCD with majority being clustered within LMICs.19 With the ongoing global obstetric transition the contribution of NCDs to maternal mortality is expected to rise also,20 highlighting a need to re-strategize and accommodate measures needed to consider and manage NCDs within maternal healthcare services.21
Tanzania is experiencing an increasing prevalence of overweight and obesity in the general adult population, with a high prevalence in urban areas of 30-37% in 2021.22,23 Existing evidence of the ongoing nutrition transition in rural areas of Tanzania suggests a likelihood of an increasing prevalence of being overweight (16%) and obese (6%) among rural residents similar to urban areas.24 Among adult women, the prevalence of overweight and obesity doubled from 11.2% in 1991 to 21.6% in 2016.25 Considering the association of overweight and obesity among women of reproductive age with NCDs and the resulting reproductive health-related morbidity and mortality, we intend to study the evolution over time and factors associated with women’s BMI using a robust nationally representative database to inform stakeholders of the potential need to develop and implement context-specific interventions relevant to this issue.
This study aimed to describe the change over time in the distribution of BMI among women of reproductive age intending to conceive in Tanzania between 2004/5 and 2015/16 and identify factors associated with high BMI in 2015/16.
METHODS
Study design
This is a cross-sectional study using secondary data. We used three consecutive Demographic and Health Surveys (DHS) in Tanzania to characterize changes in BMI distribution over time and analyzed factors associated with high BMI among women using data from the most recent survey.
Setting
We used the last three Tanzanian DHS conducted in 2004/5, 2010 and 2015/16. These nationally representative household-based surveys were conducted using standardized protocols with country-specific adaptations. Briefly, the survey uses multistage cluster sampling, with the initial stage involving the selection of clusters and the second stage selection of households. The survey questionnaires captured dimensions of reproductive and child health characteristics, anthropometric and nutritional status variables, individual and household socio-demographic characteristics.26–28
Population
Because of the importance of pre-conception BMI to maternal and perinatal outcomes, we included women of reproductive age (15 to 49 years) who resided in sampled households and were interviewed by the DHS and who reported wanting to have children in the next two years or within an undecided future period. We excluded women who had undergone female sterilization, were declared infecund, or reported not wanting to conceive in the future. We also excluded women who reported being pregnant at the time of the survey due to the physiological weight gain that occurs during pregnancy.
Outcomes
Height and weight were measured as per DHS protocols by trained personnel. BMI was calculated by dividing body weight (kg) by squared height (m²). We used BMI as a continuous variable and classified it into categories. For women aged 20 years and older, we classified BMI into four categories: underweight (BMI ≤ 18.5kg/m2), normal weight (>18.5 to <25 kg/m2), overweight (≥25 to <30kg/m2) and obese (≥30kg/m2).29 In the age group 15-19 years, BMI was classified as underweight (z-score ≤-2), normal weight (z score >-2 to <1), overweight (z score ≥ 1 to < 2) and obese (z score ≥ 2) using age-specific z-scores based on WHO guidelines.30 We also constructed a combined category of ‘high’ BMI by combining women who were overweight or obese.
Covariates
Variables theoretically associated with high BMI and available on the DHS included residence (rural or urban); zone of residence (Central, Lake, Western, Northern, Southern highland, South-west highlands, Southern, Eastern, and Zanzibar); household wealth classified by DHS using a quintile distribution into poorest, poorer, middle, more affluent and richest; health insurance coverage (yes or no); parity (0, 1-4 and ≥5); women’s highest reached education level (no formal education, at least primary education, at least secondary education or university/college education); occupation at the time of survey (not working, unskilled manual, household and domestic, services, agricultural, skilled manual, professional /technical /managerial/clerical); 5-year age group at the time of the survey, and marital status at the time of the survey (married or living together or single/widowed/separated/divorced). The 2004/5 survey had no variable for health insurance coverage; four women had missing values for insurance coverage and 12 for occupation on the 2010 survey. The 2015/16 survey data contained no missing values in variables used in regression analysis.
Data analysis
We analyzed the data using Stata SE version 14.1 (StataCorp, College Station, TX, USA). The normal distribution of BMI as a continuous variable was assessed using the Shapiro-Wilk test, which indicated a significant departure from normality (P<0.001). The distribution across the three surveys were described using median and Interquartile Range (IQR) by survey year/s. We used counts and percentages for categorical variables to describe the data across surveys. Differences of distribution (proportion) of the outcome (BMI) across the surveys were tested using Kruskal-wallis rank test. Using crude and multivariable logistic models, we used the most recent survey (2015/16) to estimate the association between the selected covariates and outcome (high BMI). We analyzed factors associated with high BMI as a binary variable (normal BMI and high BMI), excluding the underweight category since effect modifiers for underweight to normal weight differ from those of normal weight to overweight or obesity. We then considered BMI as an ordinal variable (normal weight, overweight, or obese). We conducted an ordinal multivariable logistic regression analysis to test whether the measure of the effect of the independent variable had different results when overweight and obesity were considered separately. The results are shown separately in the Online Supplementary Document (Table S1) with adjusted odds values similar to the binary multivariable logistic model. Normal weight was considered a reference category for multivariable logistic regression analysis.
We expressed the measure of effect in terms of crude and adjusted odds ratios (OR) with their 95% confidence interval (CI). We used the svyset command in STATA to adjust for the survey’s individual sampling weights, clustering and stratification in all analyses. All tests with P<0.05 were considered statistically significant.
Ethics approval
The DHS received government permission, used informed consent and assured respondents of confidentiality. We conducted secondary data analysis of the available anonymized data with permission from the DHS.
RESULTS
Characteristics of the study population
We included information on 6,731 women from the 2004/5 survey, 5,011 from 2010, and 9,077 from 2015/16. From each survey, women with flagged (missing and improbable) BMI values were excluded from the analysis (n=76 in 2004/5, n=53 in 2010 and n=87 in 2015). A flowchart showing the distribution of women included in the analysis is in Online Supplementary Document, Figure S1. Table 1 shows the women’s characteristics across the three surveys. In all three surveys, about two-thirds of women resided in rural areas, while about a quarter of the women were from the Lake zone. Women in the lower or lowest wealth quintile decreased from 2004/5 to 2015/16 survey, while those with health insurance increased from 5.8% (2010) to 8.1% (2015). Lastly, the percentage of women with at least secondary education increased from 10.4% in 2004/5 to 28.8% in 2015.
BMI changes over time
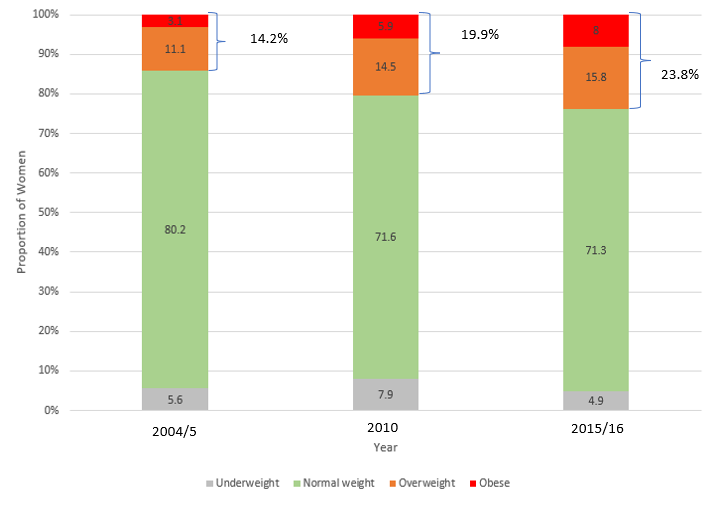
Median BMI increased from 21.7 kg/m2 (IQR=19.9 – 24.1 kg/m2) in 2004/5 to 22.0 kg/m2 (IQR=20.0 – 24.8 kg/m2) in 2010 to 22.7 kg/m2 (IQR=20.4 – 26.0 kg/m²) in 2015/16. The prevalence of normal BMI decreased from 80.2% (2004/5) to 71.6% (2010) and 71.3% (2015/16). The prevalence of overweight increased from 11.1% in 2004/5 to 14.5% in 2010 (P< 0.001) and 15.8% in 2015/16 (P< 0.001). The prevalence of obesity increased from 3.1% in 2004/5 to 8.0% in 2015/16 (P< 0.001) (Figure 1). The prevalence of high BMI (overweight and obesity combined) increased from 14.2% to 23.8% (P< 0.001) in the same period.
Factors associated with high BMI from the 2015/6 survey.
In univariate analysis, compared to nulliparous women, women with 2-4 children had almost three times greater odds of high BMI (P<0.001) and those with health insurance coverage had 1.7 times higher odds of high BMI than those without. Women residing in urban areas had 2.7 greater odds (P<0.001) of high BMI compared to those in rural areas, and those married or living with a partner had 1.8 greater odds of high BMI than those who were single or living alone (P<0.001) (Table 2).
After controlling for other factors in a multivariable model, parity, marital status, health insurance coverage, highest level of education, and residence were no longer significantly associated with high BMI. Older age group was associated with greater odds of high BMI. Women in the 40–44 age category had 3.9 greater odds (95% CI=2.9 – 5.4, P<0.001) of high BMI compared to women 20–24 years. Women from the wealthiest households had nearly 5 times greater odds of high BMI than those in the lower wealth quintile (95% CI=3.4 - 6.3, P<0.001). Women from the Southern and Southwestern zones of the country had higher odds (aOR=1.9, 95% CI=1.5 - 2.5, P<0.001) of high BMI than women from the Lake zone. Women who did -skilled working-class jobs or those dedicated to household/domestic work had greater odds of high BMI than women working in agriculture.

DISCUSSION
In this study, we analyzed a nationally representative data to show the changes in Tanzania for the prevalence of high BMI among women intending to conceive over time. We found that between 2004/5 and 2015/16, the prevalence of high BMI increased from 14.2% to 23.8% due to an increase in the prevalence of both overweight and obesity BMI categories. In addition, the prevalence of underweight decreased over the time period under consideration. Women who were older, residing in the Southern zones, from wealthier households, to a higher skilled working class had greater odds of high BMI in 2015/16 than their counterparts.
The increasing prevalence of high BMI among women of reproductive age reflects the pattern seen among everyone in the general population. Globally, there is an increase in the prevalence of high BMI.31 In Africa, the increase in the prevalence of high BMI has been related to other public health morbidities.32 Specifically, Uganda has also witnessed a similar prevalence of high BMI among women of reproductive age.33 In Dar es Salaam, Tanzania, a study showed that more than half of the women of reproductive age were overweight or obese.34 Related studies conducted among people with similar demographic characteristics are limited. However, reviews in Europe and Africa on maternal obesity (closely associated with pre-pregnancy BMI status) are on the rise.35,36
While drivers of high BMI globally vary, the global trend towards increased access to high-caloric foods, often ultra-processed with suboptimal nutritional profiles and inexpensive, which has led to the obesity epidemic in high-income countries37,38 is also observed in LMICs through increased commercialization and penetrative food marketing.39 What is common in both settings is the co-existence of calorie-dense diets with low energy expending activities as a result of industrialization with less manual labor or subsistence farming and advanced technology that promotes sedentary lifestyles.40,41 Additionally, national-level policy drivers such as lower prices for high-calorie diets even in rural areas and their commercialization contribute to this increasing burden of overweight and obesity.42,43 Cultural perceptions can contribute to this growing burden; for example, the difference in an ideal body size in Japan43 differs from the perceived African ideal body size.44,45
The increasing prevalence of high BMI in this study also highlights the co-existence of multiple forms of malnutrition among women of reproductive age in Tanzania. In addition to the rising prevalence of high BMI, women in the country also bear a high prevalence of anemia, reported to be at 57%46 with an accompanying prevalence of folate deficiency at 26%47 and of iron deficiency at 33%.26 Maternal anemia is a risk factor for maternal mortality (the risk of maternal mortality doubles with maternal haemoglobin less than 7gm/dl).48 While as the pre-pregnancy BMI increases from overweight to obesity, the odds of maternal death increase from just over two times to over three times those with normal BMI.49 The compounding effect of anemia and high BMI could be even more catastrophic to the well-being of women in Tanzania. This needs immediate action from the health system to protect the health of women and contribute to lowering the risk of maternal and perinatal mortality and morbidity in Tanzania.
Our results also show that older women living in relatively wealthier households and in a professional working class had greater odds of a high BMI. This can be hypothesized to be due to policies that enhance access to more high-energy foods and less energy-consuming activities, similar to what has been observed for individuals of such socio-economic positions in African countries, including Tanzania.16,33,50,51 Women from high agricultural food-producing zones (the Southern and Southwest zones) had greater odds of having high BMI than those in the Lake zone. This could be due to these being high -producing zones in the country and having access to diverse food, which has been linked withigh BMI in Tanzania.50
Having a high BMI before conception is linked to worse outcomes during and after pregnancy, including but not limited to gestational diabetes, or preeclampsia and an increased risk of type 2 diabetes mellitus.3 On the healthcare service delivery, there have been improvements in access to quality health services in Tanzania. However, health facilities are still not well equipped to screen or manage NCD-related conditions relative to the capacity for managing communicable diseases.52 This calls for immediate action to address this rising burden of nutritional morbidity (high BMI) as a factor contributing to maternal mortality and morbidity in Tanzania. Incorporating weight management interventions within antenatal care and during the postnatal period have been suggested to address and prevent this burden and should be tailored to specific country contexts.53
Strengths of this study include the use of nationally representative, comparable data of high quality. We classified BMI based on the standard WHO classification of BMI. We also leveraged the information on the DHS employing multivariable models that partially account for the effects of other variables on increased BMI, although residual confounding cannot be ruled out. We were also somehow limited by the lack of data on women’s intention to conceive in the near future. We acknowledge that women who intend to get pregnant might not be able to, and vice versa, women who did not intend to get pregnant (and were thus excluded from our study sample) might do so. Lastly, from 2016 to now, a lot may have changed, but the 2015/16 survey was the latest available TDHS data set. Still, these results are valid and help to highlight the need to accommodate high BMI-related reproductive health needs in the Tanzanian health system.
CONCLUSIONS
The prevalence of high BMI among women of reproductive age who intend to conceive is increasing in Tanzania, in both rural and urban areas. In a country where communicable diseases and undernutrition have historically challenged maternal health, innovative strategies to improve access to healthy lifestyles will need to be implemented. We recommend developing context-specific and culturally sensitive policies and interventions for addressing BMI-related challenges in women of reproductive age in Tanzania. These can be incorporated into available systems – to improve screening and linkage to care on high BMI-related morbidities, promoting physical activity, and having a safe exercising environment for the community, particularly targeting women of reproductive age.
Disclaimer
The views expressed in this manuscript are the author’s opinion and do not represent the official opinion of the institutions the authors are affiliated.
Ethics statement
The DHS received government permission, used informed consent and assured respondents of confidentiality. We conducted secondary data analysis of the available anonymized data with permission from the DHS.
Data availability
Data were obtained from the DHS and are available from https://www.dhsprogram.com/data/dataset_admin with the permission of the DHS.
Funding
The APC was funded by Directorate-general Development Cooperation and Humanitarian Aid Belgium – Sandwich PhD; Sida Muhimbili University of Health and Allied Sciences, Reproductive and Child health sub-program – funded the training course in the development of the manuscript.
Authorship contributions
Conceptualization, A.K.; methodology, A.K., N.M., B.B., A.B.P., A.S, L.B, and J.L.P; formal analysis, A.K., L.B., A.S and J.L.P.; writing—original draft preparation, A.K. and N.M.; writing—review and editing final draft, A.K., L.B., A.S., J.L.P., B.B., N.M., and A.B.P. All authors have read and agreed to the published version of the manuscript.
Disclosure of interest
The authors completed the Unified Competing Interest form at http://www.icmje.org/disclosure-of-interest/ (available upon request from the corresponding author) and declare no conflicts of interest.
Additional material
This manuscript contains additional information in the Online Supplementary Document.
Correspondence to:
Amani Kikula, MD, MMed (Obstetrics and Gynaecology), PhD candidate; P.O. Box 60371 Dar es salaam, Ilala – 11103; Email address – [email protected].