
In 2000, countries around the world accepted the commitment to reach the millennium development goals (MDGs).1 Such commitment resulted in political momentum, new investments and mobilization to implement practical actions necessary to improve the quality of life of its citizens. Specific goals included the reduction of the under-five mortality rate by two-thirds (MDG 4) and maternal mortality ratio by three-quarters (MDG 5) from 1990 to 2015.1 Since then, countries have made to achieve progress towards the MDGs. Global under-five mortality rates have more than halved, from 90 to 43 deaths per 1,000 live births between 1990 and 2015, and the maternal mortality rate by 45% worldwide, with further reductions occurring since 2000.2 Guyana is among the countries committed to achieving the MDGs by 2015. A country report published in 2011 highlighted the progress made by Guyana during the MDGs era.3 The under-five mortality rate dropped from 120 per 1,000 live births in 1991 to 17 per 1,000 live births in 2008, which corresponded to a reduction of 85.8%. Likewise, the maternal mortality ratio fell from 320 deaths per 100,000 live births in 1991 to 86 deaths per 100,000 live births in 2008, representing a drop of 73.0% in the indicator.3 Such progress can be explained by the government’s efforts to improve the training and recruitment of qualified health professionals, development of health policies and programs, and expansion of health services, among others.3,4
The MDGs ended in 2015 and countries worldwide including Guyana are still committed to the sustainable development goals (SDGs) to achieve a world of prosperity, equity, freedom, dignity, and peace. The SDGs include 17 goals and 169 targets, with target 3 (SDG 3) aiming to reduce the global maternal mortality ratio to less than 70 per 100,000 live births (SDG 3.1) and neonatal mortality to at least as low as 12 per 1,000 live births and under-5 mortality to at least as low as 25 per 1,000 live (SDG 3.2).5
One of the main strategies used by countries and agencies to measure progress in the health sector is through national surveys.6–8 Since 2006, Guyana has conducted several national health surveys that can be used to assess progress on the reproductive, maternal, newborn and child health (RMNCH) indicators over time. This study aimed to assess the patterns of change in (RMNCH in Guyana from 2006 to 2019.
METHODS
Four nationally representative Demographic and Health Surveys (DHS) and Multiple Indicators Cluster Surveys (MICS) conducted in Guyana by the Bureau of Statistics (BOS) and the Ministry of Health (MOH) from 2006 to 2019 were assessed. DHS received technical assistance from ICF Macro and funds from the United States Agency for International Development (USAID/Guyana) under the measure DHS program.9 MICS received technical and financial support from the United Nations Children’s Fund (UNICEF), the Inter-American Development Bank (IDB) and the Government of Guyana.10 The surveys were conducted in 2006 (MICS), 2009 (DHS), 2014 and 2019 (MICS). Both surveys used standardized questionnaires to collect data on several socio-economic, demographic and health indicators for the general population as well as for subgroups of women aged 15-49 and children under-five. Health indicators included but were not limited to reproductive health (contraception, family planning), pregnancy, delivery, postnatal care for both women and newborns, immunizations, and nutritional status. Information on these indicators was provided by women of reproductive age (15 to 49 years old). The Institutional Review Board at the Ministry of Health (MOH-IRB) approved both DHS and MICS. DHS and MICS data are made publicly available for research purposes. Thus, it was not necessary to seek approval from any local institution to conduct the study. More details on DHS and MICS can be found elsewhere.9,10
Additionally, several RMNCH coverage and impact indicators were assessed. The coverage indicators included reproductive health indicators such as the current use of modern contraceptives and demand for family planning satisfied with modern methods. Maternal indicators included antenatal care (at least four or more visits), tetanus toxoid in pregnancy, a skilled attendant at delivery (SBA), and institutional delivery. For newborn and child health indicators, early initiation of breastfeeding (within one hour of birth), exclusive breastfeeding (0-5 months), coverage with BCG (Bacillus Calmette-Guérin) vaccine, diphtheria, pertussis, and tetanus immunization (DPT: three doses), measles and polio vaccines, care seeking for pneumonia, and oral rehydration salt (ORS) were assessed. Also, for children 12-23 months the full vaccination coverage was assessed with attention being placed on those children who received all doses of BCG, DPT, measles, and polio vaccines. The composite coverage index (CCI), a weighted average of the percentage coverage of eight preventative and curative interventions along four stages of the continuum of care of reproductive and maternal health, childhood immunization, and management of childhood illness was also estimated. Details on the definition of the indicators used and the calculation of CCI can be found elsewhere.11 In addition, the prevalence of low birth weight (<2500gr at birth regardless of gestational age), under—five stunting prevalence, and the neonatal and under-five mortality rates were assessed. Details on the definition of the indicators can be found elsewhere.12
Coverages for most of the indicators were assessed in the last five years. However, indicators such as antenatal care with four or more visits (ANC4+), SBA and low birth weight were available in the last two years for MICS, and in the last three and five years for DHS. Thus, such indicators were assessed in the last two years (MICS) and three years (DHS) to facilitate comparison.
Data from United Nations Inter-agency Group for Child Mortality Estimation (UN IGME)13 was used to assess national time trends in under-five mortality and by wealth quintile from 2006 to 2019. However, because data from UN IGME for neonatal mortality are not disaggregated by urban-rural place of residence and by wealth index, estimates from DHS (2009) and MICS (2019) were used to assess inequalities for neonatal mortality rate over time.
Stratified
All the indicators were assessed by urban and rural places of residence and by wealth index scores. The wealth index score was pre-calculated in both DHS and MICS. It is calculated through principal component analyses (PCA) using variables on household assets, building materials of the dwelling, and access to utilities such as electricity, water, and sanitation.14 The wealth index is presented in quintiles where quintile 1 (Q1) represents approximately the poorest 20% of households and quintile 5 (Q5), the richest 20%.
Statistical analyses
Descriptive time trend analyses were performed for all the indicators, and stratified by place of residence, and by wealth quintile. Standard errors and a 95% confidence interval were also estimated. Moreover, the average absolute annual change (AAAC) of the indicators was assessed using a weighted variance regression.15 We assessed statistical significance (P-value <5%) for each indicator over time using the Mann-Kendall test.
The slope index of inequality (SII) and the concentration index of inequality (CIX), which are two measures of socioeconomic inequality were calculated to assess trends in inequality over time. Both SII and CIX are complex measures of inequality that use a single number to express the amount of inequality across all subgroups of a population with natural ordering. SII is a measure of absolute inequality and represents the absolute difference in percentage points between the adjusted coverage at the two extremes of the wealth distribution considering all other subgroups. SII takes values from -100 to 100, where zero (0) means no inequality. Positive values indicate that the indicator is more prevalent in rich subgroups, and negative values indicate that the indicator is more prevalent in poor subgroups. For adverse health outcomes such as low birth weight and mortality rate, a positive value indicates that the indicator is more prevalent in poor subgroups, and a negative value indicates that the indicator is more prevalent in rich subgroups.16–18
CIX is a measure of relative inequality, and indicates the extent to which a health indicator is concentrated among the disadvantaged or advantaged subgroups. It is similar to the Gini index, which is commonly used to describe the concentration of income. CIX also takes values from -100 to 100, where zero means the absence of inequality between subgroups. Positive values indicate a concentration of the health indicators among the richest, while negative values indicate a concentration of the health indicators among the poorest.16–18 The data used for this analysis can be found on the UNICEF website (https://mics.unicef.org/).
All the analyses were carried out using Excel 2016 and STATA (StataCorp. 2015. Stata Statistical Software: Release 15. College Station, TX: StataCorp LP).
RESULTS
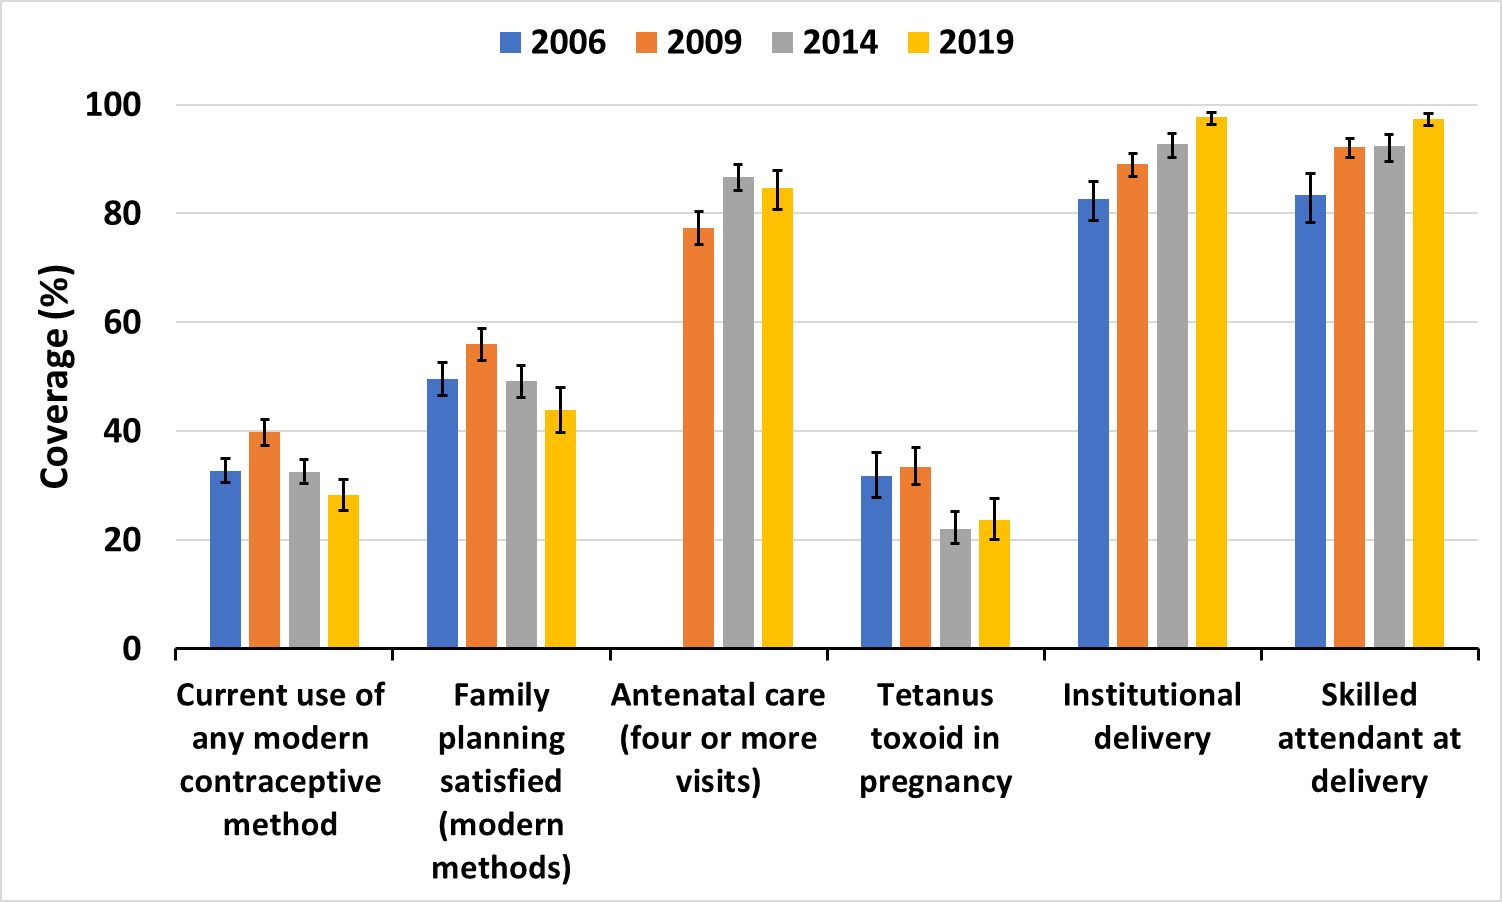
From 2006 to 2019, the percentage of women currently using a modern method of contraception decreased from 32.7% to 28.2%, and family planning needed satisfaction with a modern method from 49.6% to 43.8%. The percentage of pregnant women who received ANC4+ increased from 77.4% to 84.7% from 2009 to 2019, while the proportion of pregnant women vaccinated with tetanus toxoid decreased from 31.7% to 23.9%. Coverages of institutional delivery and skilled attendant at birth increased from 82.6% to 97.7% and from 83.3% to 97.4% respectively over the same periods (Figure 1).

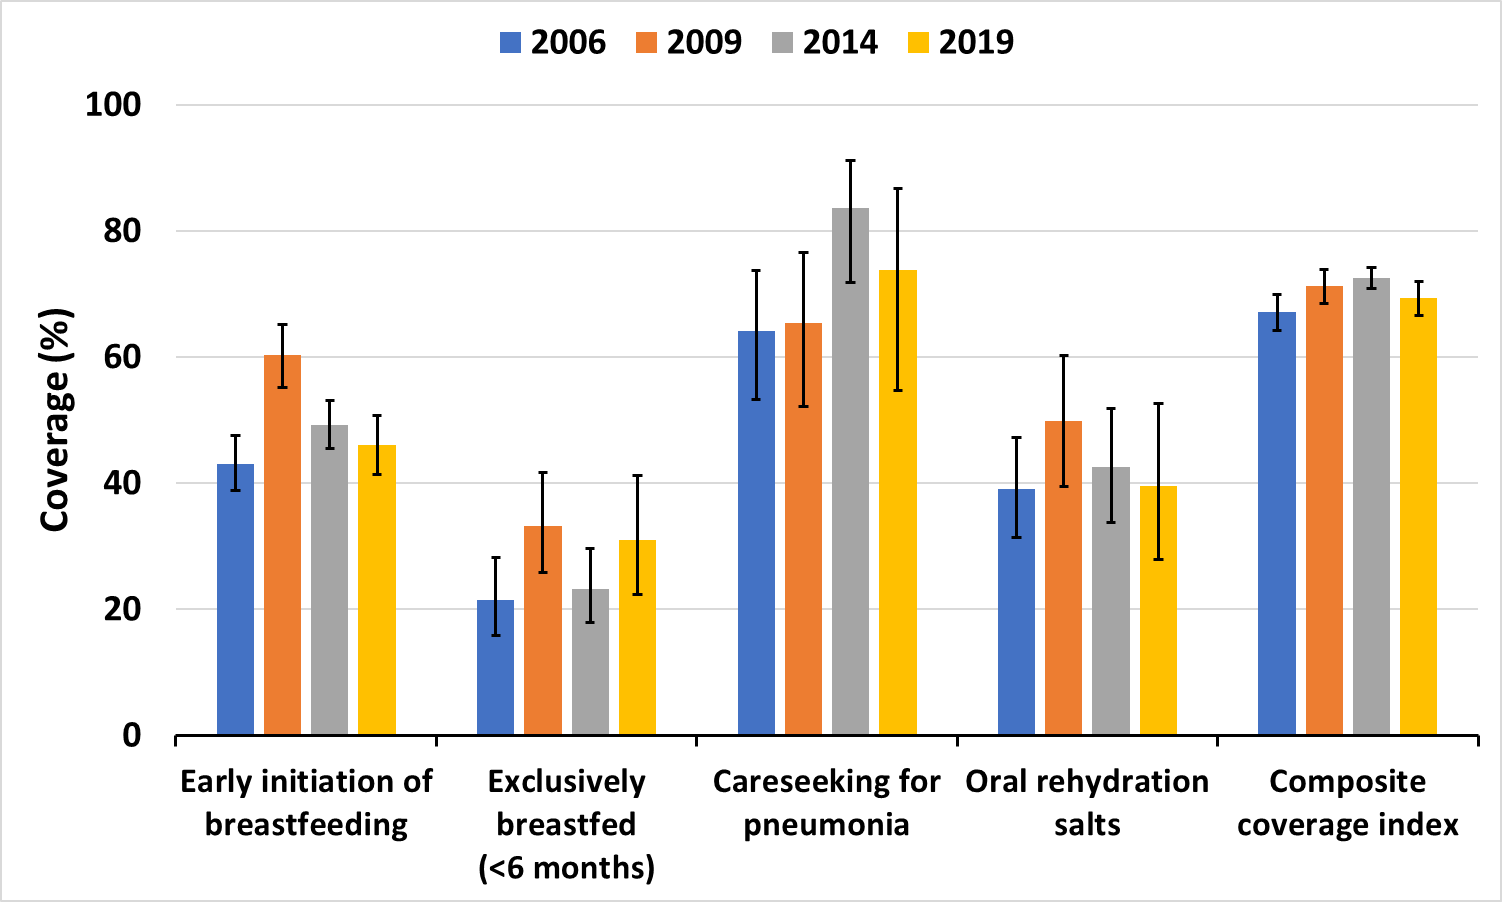
The percentage of newborns breastfed immediately after birth (within one hour) increased slightly from 43.1% in 2006 to 46.0% in 2019. The percentage of children exclusively breastfed (0-5 months) increased from 21.4% to 31.0%. Care-seeking for pneumonia increased from 64.1% to 73.7%. No change was observed for oral rehydration during the same periods. The composite coverage index increased only slightly from 67.5% to 69.3% (Figure 2).

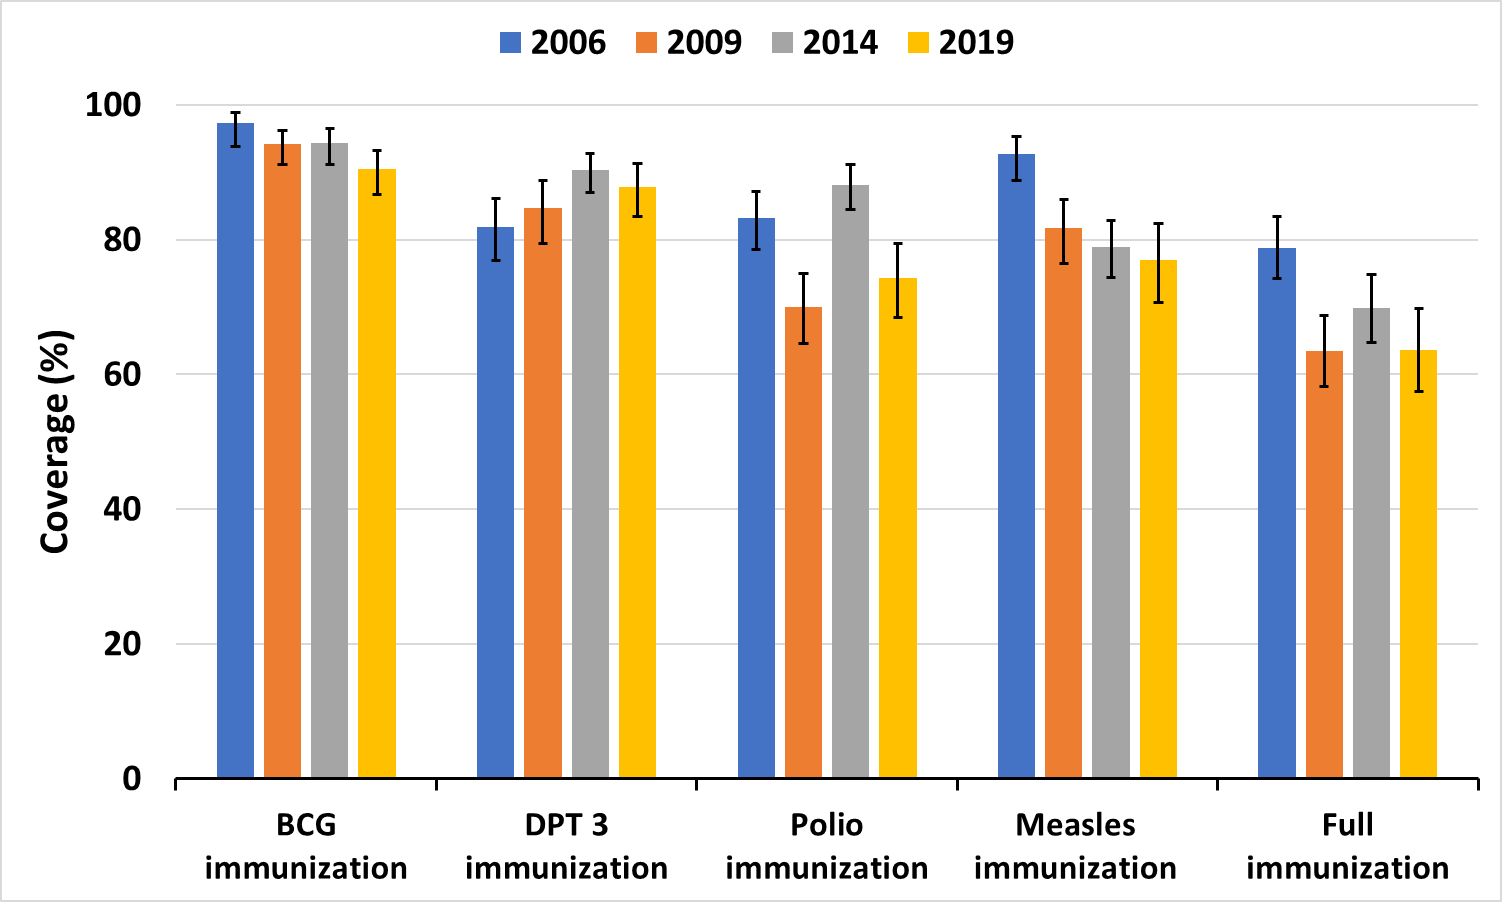
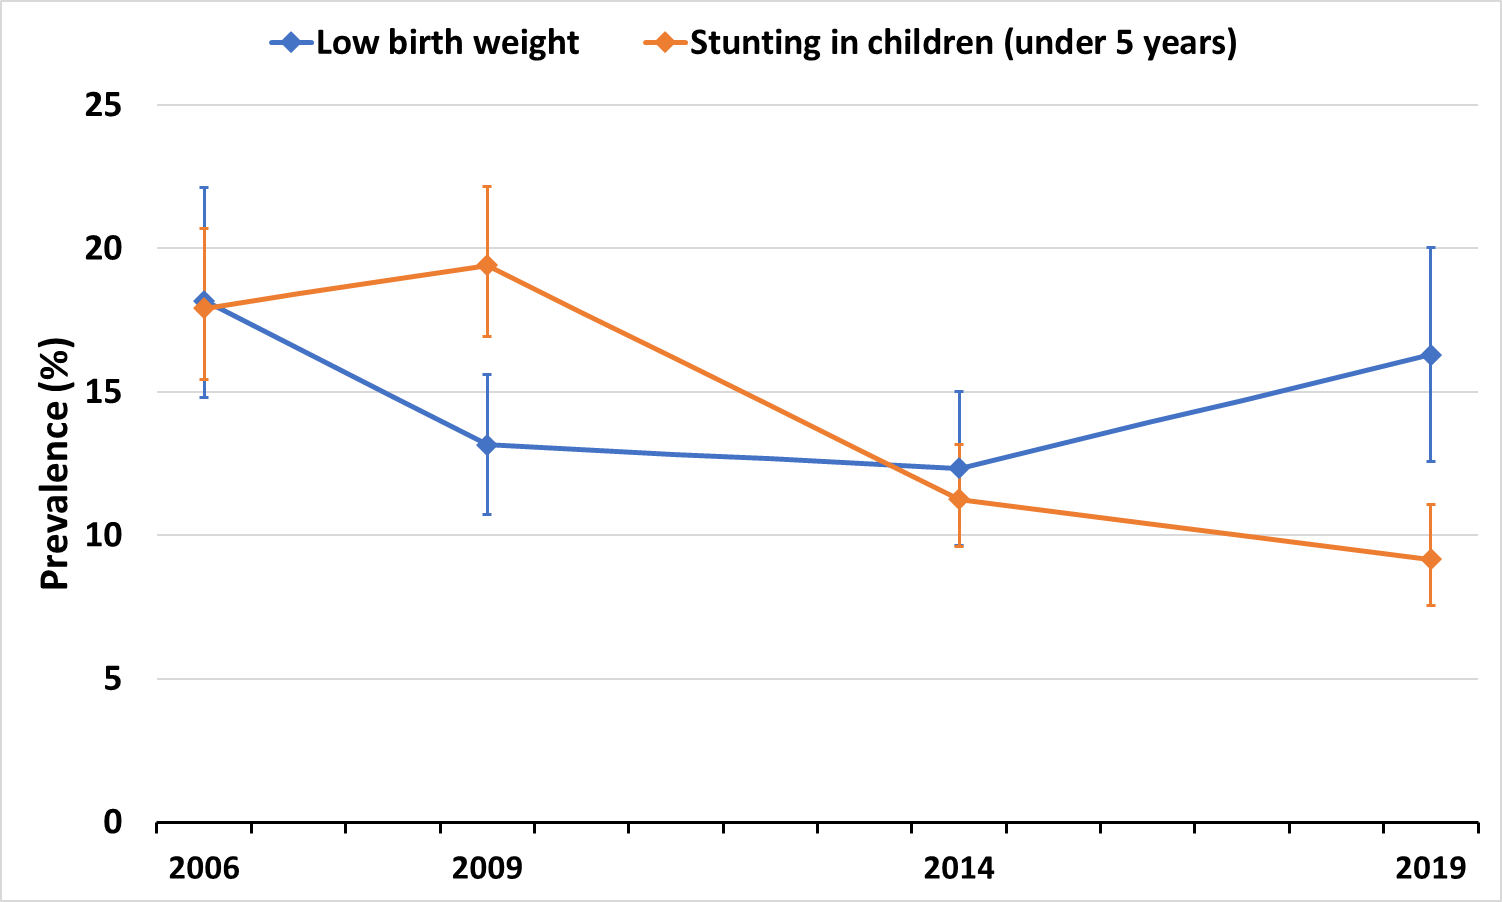
Except for DPT(three doses) that showed a slight increase from 83.7% in 2006 to 87.9% in 2019, all the other vaccines (BCG, measles and polio) showed a decrease from 2006 to 2019. Full immunization coverage also decreased from 82.0% to 63.6% (Figure 3). The prevalence of low birth weight decreased from 18.2% to 16.3%. Under-five stunting decreased significantly from 18.0% to 9.2% (Figure 4).


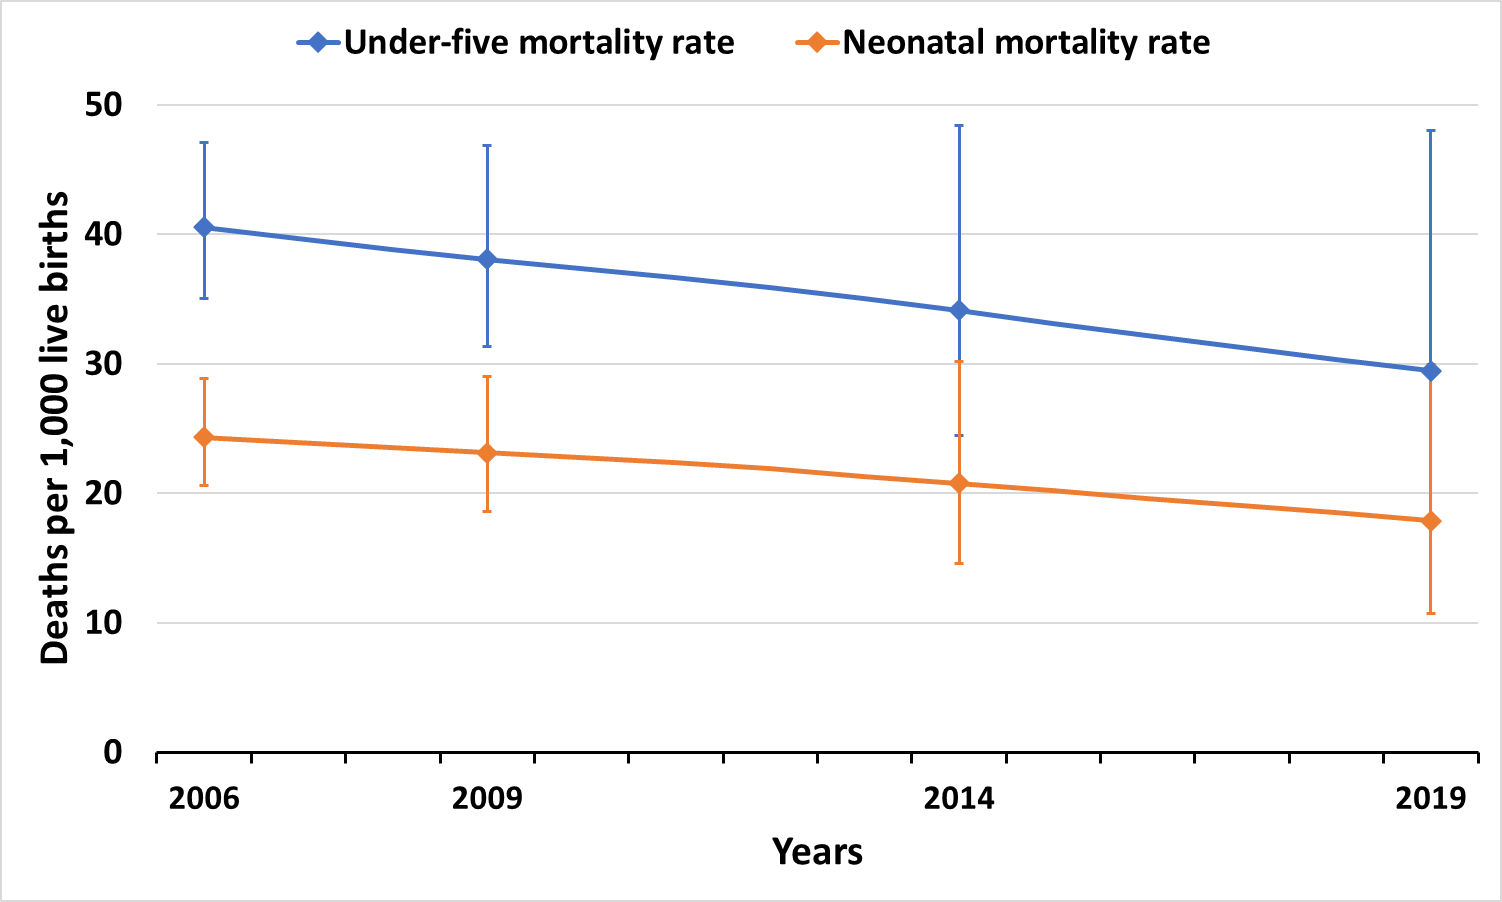
The neonatal mortality rate decreased from 24.0 to 18.6 per 1,000 live births, which represents a reduction of 22.5% from 2006 to 2019. Likewise, the under-five mortality rate decreased from 40.4 to 29.3 per 1,000 live births during the same periods (Figure 5). Analyses of temporal changes at the national level did not reveal a statistically significant difference in the pattern of evolution of the indicators over time (P-value>5%).

Assessment of the AAAC of the indicators showed that about seven intervention indicators (ANC4+, institutional delivery, SBA, exclusive breastfeeding, care-seeking for pneumonia, DPT3, and CCI) had a positive increase in their coverage from 2006 to 2019 (Table S1 in the Online Supplementary Document).
Figure S1 to Figure S6 present time trends in RMNCH inequalities from 2006 to 2019. The percentage of women who used a modern contraceptive and who had a demand for family planning needed satisfied decreased for all subgroups, but with a reduction in the gap between the poorest and richest from 2006 to 2019 (Figure S1). The SII for modern contraceptive use decreased from 2.4 p.p. to minus 1.4 p.p., and the demand for family planning needed satisfied from 5.7 p.p. to 1.4 p.p. from 2006 to 2019 (Table S2). The percentage of pregnant women who received ANC4+ increased slightly from 72.6% to 75.1% for the poorest, and from 83.4% to 91.8% from 2009 to 2019. However, in 2019, a bottom inequality pattern was evident with the poorest lagging well behind the other subgroups (Figure S1 in the Online Supplementary Document). The SII of inequality for ANC4+ increased from 9.1 p.p. in 2009 to 11.4 p.p. in 2019 (Table S2). In contrast, it was noted that there was a great reduction in the coverage of tetanus toxoid in pregnancy from 2006 to 2019, but with a reduction in inequality between subgroups. Coverage of institutional delivery and SBA increased from 2006 to 2019 for both the poorest and richest, with the gap narrowing over time. The SII also decreased for both indicators during the same periods (Figure S1 in the Online Supplementary Document).
Regarding newborns and child health indicators, the percentage of newborns put to the breast within the first hour after birth increased slightly from 43.4% to 48.6% for the poorest and from 33.5% to 43.9% for the richest (Figure S2). The gap between poorest and richest seems also to decrease. Likewise, there was an increase in the percentage of children under six months who breastfed exclusively. However, in 2019, the richest are well behind the other subgroups. For both care-seeking for pneumonia and ORS, the inequality pattern could not be assessed over time because the denominator for several subgroups was less than 25 individuals. The CCI increased slightly from 60.8% to 63.7% for the poorest and from 71.3% to 73.3% for the richest from 2006 to 2019 (Figure S2).
For child immunization, all the indicators assessed showed a drop in coverage for all subgroups, except for DPT3, which increased from 86.4% in 2006 to 91.4 in 2019 for the richest (Figure S3 in the Online Supplementary Document). The gaps between the poorest and richest also tend to increase over time.
Low birth weight decreased from 13.9% in 2006 to 12.6% in 2019 for the poorest but increased from 13.0% to 17.5% for the richest during the same period. The SII increased from 1.0 p.p. in 2006 to 8.6 p.p. in 2019. Great progress was observed among the poorest under-five stunting prevalence, which decreased from 27.9% in 2006 to 12.6%,while for the richest, it decreased slightly from 13.6% to 11.0% (Figure S4 in the Online Supplementary Document). Neonatal and under-five mortality rates showed progress for all subgroups from 2009 to 2019. The neonatal mortality rate dropped from 13.9 to 9.8 per 1,000 live births among the poorest, and from 25.1 to 14.2 per 1,000 live births for the richest. Under-five mortality also fell from 43.6 to 32.6 for the poorest and from 32.6 to 23.2 per 1,000 live births for the richest in the same periods (Figure S5 in the Online Supplementary Document). The gaps between the poorest and richest seemed to decrease over time (Table S2 in the Online Supplementary Document).
Analyses of absolute annual change in absolute inequalities showed that seven out of the 16 intervention indicators evaluated decreased their inequalities from 2006 to 2019 (Table S1 in the Online Supplementary Document).
In the appendixes, a summary of coverages of the indicators is presented according to the place of urban-rural residence (Figures S6-S10 in the Online Supplementary Document).
To understand whether changes in coverage indicators were accompanied by changes in inequalities over time, the AAAC in coverage was plotted against the AAAC in SII (Figure 6). We drew a horizontal line crossing the x-axis when the AAAC in inequalities equals zero, and a vertical line crossing the y-axis when the AAAC in coverage equals zero. Considering that all these indicators are good indicators, that is, the greater the coverage, the better. Thus, we obtained four quadrants, where quadrant A (Worst scenario) shows an increase in inequalities with a decrease in the coverage of the indicators over time. Quadrants B and C are the intermediate quadrants (quadrant B= increases in coverage with an increase in inequalities and quadrant C = a decrease in coverage and decrease in inequalities). The last quadrant (quadrant A) represents the best scenario with an increase in coverage and decreasing inequalities over time. We observed that institutional delivery was the best performer with an increase in coverage by 1.1p.p, and a decrease in inequality (by minus 1.7 per year) from 2006 to 2019. The CCI appeared to increase in coverage with a decrease in inequalities over time. The worst performers were BCG and measles whose coverages seemed to decrease over time with an increase in inequality. The same pattern was observed for children (12-23 months) fully vaccinated (Figure 6).

DISCUSSION
From 2006 to 2019, Guyana managed to increase the coverage of institutional delivery by 15.0% and the percentage of children who breastfed exclusively by 31.0%. Likewise, the prevalence of under-five stunting decreased by 49.0% during the same period. The neonatal mortality rate decreased by 22.5% and the under-five mortality rate by 27.4% from 2006 to 2019. However, only seven (ANC4+, institutional delivery, SBA, exclusive breastfeeding, care-seeking for pneumonia, DPT3, and CCI) out of the 16 intervention indicators assessed had a positive increase in AAAC in coverage from 2006 to 2019. Furthermore, inequalities tended to decrease for seven of the 16 intervention indicators assessed. Institutional delivery was the best performer in increasing coverage and decreasing inequality over time, followed by SBA. The CCI tended to increase in coverage over time with a decrease in inequalities. The worst performers were the immunization with BCG and measles. The percentage of children (12-23 months) fully vaccinated also showed a decrease in coverage with an increase in inequalities
There was a reduction in the gaps in both under-five stunting prevalence and under-five mortality rate between the poorest and richest. Such findings have policy implications, as they may help policymakers derive actions to improve coverage at the national level and reduce inequalities between subgroups.
The Countdown working group, in a report published in 2017, highlighted the progress toward universal health coverage for RMNCH made by 81 countries from 2000 to 2015.8
In comparison with findings from our study, we observed that the national coverage average of ANC4+, institutional delivery, skilled birth attendant, and care-seeking for pneumonia was above the global average observed for these countries. However, the opposite was observed for family planning needs satisfied with a modern method, tetanus toxoid in pregnancy, early initiation of breastfeeding, exclusive breastfeeding, ORS, and DPT3. The coverage of immunization with measles in Guyana was similar to the global average for these countries. Considering the Latin America and Caribbean countries (LAC) included in their analyses, the national coverage average observed for SBA in Guyana in 2019 was higher than the coverage for Haiti (2014), Mexico (2012), and Peru (2013). Similar results were observed for the prevalence of under-five stunting in these countries. Guyana also presented higher coverage for indicators such as ANC4+ (Bolivia-2012, Haiti-2014), exclusive breastfeeding (Haiti, 2014), care-seeking for pneumonia (Haiti-2012, Peru-2013), and ORS (Peru, 2013).8
Another study conducted by Blencowe et al. (2019) using data from 148 countries showed that the global prevalence of low birth weight was 14. 6%. Such prevalence was slightly lower than the national average observed for Guyana in this study.19 A recent study published by UNICEF/WHO showed a global prevalence of under-five stunting of 22.3% in 2022, which is more than two-fold higher than the national prevalence observed in Guyana.20 Likewise, Sharrow et al. (2022) show that the global average of NMR was 17.5 per 1,000 live births, and for the under-five mortality rate, 37.7 per 1,000 live births in 2019. Such NMR was similar to the one observed in Guyana. However, the national average of under-five mortality is less than the global average.21 The studies also showed different patterns of inequalities in the indicators within and across countries over time.8,19,21
In 2000, Guyana was among the 188 countries that signed the millennium development goals (MDGs). Since then, governments have made efforts to achieve the MDGs, particularly MDG 4 and 5 such as the implementation of nutrition and maternal and childcare initiatives, including programs for comprehensive child immunization coverage and an integrated approach to child health and development. Besides, the government has taken actions to increase access to improved facilities as well as qualified health personnel.3 Through the Public Health Act adopted in 2005 by the government, the Ministry of Health was mandated to ensure effective policy formulation, regulation, coordination, monitoring, and evaluation of the health sector. In that Act, the Ministry of Health also had the responsibility to ensure that health services are developed and provided in a comprehensive, consistent, balanced, and equitable manner within the financial resources allocated to the Ministry.22
In 2011, a report was published by the Government in collaboration with the United Nations which assessed progress made so far and presented the list of indicators that were likely, potentially, and unlikely to be met by 2015.3 In that report, the MDG 4, that is to reduce by two-thirds, between 1990 and 2015, the under-five mortality rate was presented as likely to be met.3 However, target 5B, universal access to reproductive health, was presented as unlikely to be met. The country also celebrated the progress made in reducing the under-five mortality rate by two-thirds by 2015, as well as efforts to increase the availability of skilled health workers at the time of childbirth. In 2013, the Government, through the Health Vision 2020, once again committed to increasing its human resources for health through training, recruitment, and retention of highly motivated and qualified health professionals.4,23,24 It was also committed to improving service delivery through the establishment of Integrated Health Service Delivery Networks; to achieve universal health coverage and reduce health inequalities by 2020, among others.4 Data from the World Health Organization showed that Guyana was able to increase the number of medical doctors from 4.9 to 18.2 per 10, 000 inhabitants from 2000 to 2018.25 Nursing and midwifery personnel also increased from 23.3 in 2000 to 35.3 per 10,000 inhabitants during the same period.25 In 2006, it was recognized by law that every Guyanese citizen has the right to free medical care.26 In 2013, the Ministry of Health (MoH) launched the 2020 Health Vision with a focus on providing equitable access to healthcare services, achieving universal RMNCH health coverage, and reducing health inequalities.27 These efforts can contribute to the progress seen in mostindicators such as the prevalence of stunting in under-fives, which declined by nearly 50% from 2006 to 2019. Futhermore, the actual prevalence of under-five stunting of 9.2% is well below the average of 11.8% observed in 2021 for Latin America and the Caribbean countries.20
The MDGs ended in 2015, and Guyana was among the countries committed to accelerating progress on the 2030 sustainable development goals (SDGs) agenda, particularly SDGs 3.1 and 3.2. The Guyana Country Cooperation Strategy published in 2016 recognized that more efforts must be made to reach universal coverage by leaving no one behind.28 With an actual neonatal mortality rate of 18.6 and an under-five mortality rate of 29.3 per 1,000 live births in 2019, Guyana is among the countries on track to achieve SDG 3.2 by 2030; that is to reduce the neonatal and under-five mortality rate to least as low as 12 and 25 per 1,000 live births respectively. However, efforts must be made to reduce inequalities between subgroups. The reasons for the observed decline in several key RMNCH indicators, particularly immunization coverage, remain unknown. However, the geopolitical constraints Guyana faces in distributing equitable health services to the population, especially those living in the rural interior of the country, must be noted.4,29 A report published by PAHO/WHO in 2015 had already warned of the stagnation and drop observed in vaccine coverage across the Caribbean, and countries were encouraged to work harder to achieve at least national coverage greater than 95% for all.30
The Health Vision 2040 also raised concerns on the situation of health inequalities between several Coastland and Hinterland communities, which are often struggling with inadequate health facilities and services, the shortage of doctors and other trained specialists, shortages of medicines, and health centers that were not well equipped, among others. The health vision 2030 aligns with the health vision 2040 aim to keep Guyana in progress by increasing health coverage, reducing inequalities between subcategories of the population, increasing health financing, and providing better health services.31,32
Our analyses have strengths and limitations. We assessed changes in coverage and impact indicators in Guyana using four nationally representative sample surveys conducted in the country from 2006 to 2019. We systematically compared inequalities in coverage and impact indicators using the asset indices, which would not be possible with other more complex measures of socioeconomic position.33 We, also, defined inequality based on wealth asset indices and place of residence, a common tool used globally to assess inequalities within populations.34 Besides, both DHS and MICS produce highly comparable estimates over time and within a population.35,36 However, it was possible to compare respondents with data from the population Census to test the accuracy of the information provided and identify possible systematic errors. Besides, to account for better precision of the estimates, indicators with cells fewer than 25 individuals as denominators were excluded from the analyses.37 We were unable to assess the role of social determinants such as antipoverty strategies, health system reforms, health sector financing, health policy adoption, implementation of specific public health RMNCH interventions, international assistance, and NGOs on the patterns of changes of the indicators over time.
CONCLUSIONS
This study showed how RMNCH indicators in Guyana have changed from 2006 to 2019 at both the national level, by urban-rural place of residence, and by wealth quintile. Patterns of inequalities over time and the subgroups that need more attention were highlighted. Furthermore, the study revealed which indicators were considered to have the best performance in increased coverage and decreased inequalities over the same period. Such findings can be used to praise the efforts made by the country in recent decades to improve the health of its citizens. However, the decline observed in several key RMNCH indicators, particularly in full immunization coverage, can be seen as a wake-up call to redouble efforts to achieve universal health coverage and reduce inequalities among subgroups. We recommend that the findings from this study be used as guidance for policy actions for further improvement of RMNCH by 2030. A combined quantitative and qualitative research approach is necessary to understand the drivers for progress observed in some RMNCH indicators including the main bottlenecks for the decline in the other indicators.
Disclaimer
The views expressed in this submitted article are our own and not the official position of any other institution.
Funding
This study received financial support from the University of Guyana.
Authorship contributions
GJ participated in the conception of the study, obtained the data, performed the analyses, interpreted the results and was a major contributor to drafting the manuscript. LV participated in the statistical analysis, interpreted the findings and revision of the final manuscript. CB participated in the interpretation of the findings and revision of the final manuscript. All authors commented on the draft manuscript and approved its final version.
Disclosure of interest
The authors completed the Unified Competing Interest form at http://www.icmje.org/disclosure-of-interest/ (available upon request from the corresponding author), and declare no conflicts of interest.
Additional material
Refer to the Online Supplementary Document.
Correspondence to:
Gary Joseph
University of Guyana
Turkeyen Campus, Greater Georgetown
Guyana
[email protected]