

Despite significant progress in recent decades, the global burden of maternal and newborn deaths remains substantial—2.4 million newborn deaths and 295,000 maternal deaths annually in recent years.1,2 Many of these deaths could be averted with access to quality, skilled care and timely interventions, particularly during the intrapartum period and the first 24 hours following birth when an estimated 46% of maternal deaths and 40% of neonatal deaths and stillbirths occur.3
In Ethiopia, maternal and neonatal mortality rates have fallen dramatically since 2000, concurrent with large increases in the proportion of births attended by skilled health personnel from 6% in 2000-2005 to 50% in 2019.1,2,4 However, significant variations and gaps exist in the quality of childbirth care provided.5–12 A 2016 national assessment of emergency obstetric and newborn care (EmONC) found that less than half of birthing facilities had the necessary staff, medicines, equipment, and supplies required to perform specific EmONC functions, including assisted vaginal delivery (49%), removal of retained products of conception (38%), provision of antenatal corticosteroids for preterm labor (22%), and provision of intravenous fluids (29%).5 Less than half of hospitals (45%) had the necessary inputs to provide safe blood transfusion.5 Gaps also exist in provider knowledge and competencies to provide routine childbirth care and manage complications.7–9,11
To accelerate progress in maternal and newborn health, the Ethiopian Federal Ministry of Health (FMoH) has invested in an ambitious plan to improve equitable access to quality services throughout the continuum of care, with the goal to cut maternal and neonatal mortality rates by one-third in the next five years (2021-2025).13 These plans are outlined in the Health Sector Transformation Plans (I and II), National Strategy for Newborn and Child Survival, National Road Map for Accelerating Reduction of Maternal and Newborn Mortality and Morbidity, and National Healthcare Quality and Safety Strategy.13–17 Strategic initiatives include, among others, expanding operating room blocks, newborn corners at health centers, and neonatal intensive care units in hospitals; improving services for low birthweight and preterm babies; strengthening maternal and perinatal death surveillance and response systems; reinforcing referral networks; and construction or rehabilitation of facilities to attain the standard of at least one basic EmONC health center per 25,000 people and one comprehensive EmONC hospital per 100,000 people.13,15 Under the National Healthcare Quality and Safety Strategy, all levels of the health system—from the community level to the Federal Ministry of Health—are creating structures to lead quality control and quality improvement efforts, with a particular emphasis on maternal and newborn care.16,17
To guide these efforts, health authorities require actionable information about the readiness of health facilities to provide childbirth care and where gaps exist. Readiness, as defined by the World Health Organization (WHO), refers to a health facility’s capacity to provide services to ensure a minimum standard of quality of care; it is considered an important pre-requisite for providing quality care and encompasses the availability of trained staff, commodities, and equipment; provider knowledge; and functioning systems to support care quality and patient safety.18 National health facility assessments are an important source of such information. In Ethiopia, recent assessments conducted in 2014 and 2016 provided data on the state of, and gaps in, facility readiness to provide childbirth care and other services.5,6 However, there is limited information on the extent which quality childbirth care is equitably distributed—and how this may influence use of facility childbirth services by different populations. This paper shares updated results from a national facility assessment conducted in 2019 on the state of readiness to provide childbirth care, and it links these results with national household survey data to measure inequities in access and use of quality facility childbirth services in Ethiopia. Specific aims of this study are (a) to assess the readiness of health facilities in Ethiopia to provide childbirth services, (b) describe variations in geographic access to childbirth service-ready facilities by population characteristics, and (c) evaluate the relationship between facility readiness and utilization of childbirth services in Ethiopia with a lens on equity.
METHODS
Study design and procedures
The study uses cross-sectional data collected between September and December 2019 from a nationally representative sample of households in Ethiopia linked to data from service delivery points (SDPs) serving those same areas. The study design and procedures for sampling, questionnaire development, and survey implementation are described in detail in the study protocol, available elsewhere.19 Briefly, the household survey followed a multi-stage, stratified random sampling procedure. Strata were defined by region and urban-rural designation. Enumeration areas (EAs) were then randomly selected from each stratum with a probability proportional to size. Within each EA, 35 households were randomly sampled from a household listing or census, and all women aged 15-49 years who resided in selected households (or who slept in the household the previous night) were eligible to complete a questionnaire about reproductive, maternal, newborn, and child health (RMNCH) practices. All government health posts, health centers, and first level hospitals whose catchment area covers a sampled EA were eligible for the SDP survey; a subset of referral hospitals were also included. In addition, private sector SDPs located within the EA’s kebele—the lowest level administrative division in Ethiopia—were eligible to be assessed yet limited to a maximum of three private SDPs randomly selected per EA. All interviews with household and SDP respondents were conducted face-to-face by a trained enumerator and entered into a smartphone using Open Data Kit (ODK) software. During field work, data were monitored daily by the data management team to track progress and identify potential data quality issues, including flagging missing or incomplete forms and questions with high rates of non-response. When an error was suspected, the team communicated with the enumerator to confirm whether she entered the correct response so that few errors remain by the end of field work.
The survey was administered as part of Performance Monitoring for Action Ethiopia (PMA-ET), a project implemented by the Addis Ababa University School of Public Health and the Johns Hopkins Bloomberg School of Public Health, and funded by the Bill & Melinda Gates Foundation [INV 009466]. PMA Ethiopia received ethical approval from Addis Ababa University, College of Health Sciences (AAU/CHS) (Ref: AAUMF 01-008) and the Johns Hopkins University Bloomberg School of Public Health (JHSPH) Institutional Review Board (FWA00000287).
Dataset preparation and linking procedures
A total of 534 (98.9%) hospitals, health centers, and health clinics completed the SDP survey. Our analytical sample consists of the 406 facilities among these that report providing childbirth services. A total of 9,108 households (98.4%) and 8,837 (98.5%) women aged 15-49 years completed the household survey and female questionnaire, respectively. We linked households to health facilities using two data linking procedures: (a) administrative catchment area and (b) geographic proximity (Figures S1-S2 in the Online Supplementary Document). All SDP surveys include a variable indicating which PMA-Ethiopia EAs fall within its catchment area, allowing for linkages between health facilities and households. In the first method, datasets were linked using this variable. All respondents were successfully matched with at least one health facility, and 84.6% linked to both a government hospital and government health center as expected based on sampling procedures (Table S1 in the Online Supplementary Document). Respondents may not link to both facility types if one is no longer functional, does not offer childbirth services, did not respond to the survey, or if a health center was recently upgraded to a primary hospital (and no new health center was constructed). For the second linking method, we mapped SDP and household locations in ArcGIS and linked the household residence of female respondents aged 15-49 to the nearest government hospital and the nearest government health center offering childbirth services based on Euclidian distances.
To better understand how the service environment varies by levels of urbanization, we added population density data from WorldPop20 and calculated SDP proximity to cities with populations of at least 50,000 according to 2017 projections by the Central Statistical Agency of Ethiopia.21 Using this information, SDP locations were categorized as city, suburban, town, or rural according to classification guidelines endorsed by the UN Statistical Commission.22 The World Geodetic System 1984 (WGS84) was used for the coordinate reference system and geographic datum.
Measurement
We calculated readiness scores for each health facility in the sample using a childbirth service readiness index developed and validated in the Ethiopian healthcare setting, comprised of 44 items for health centers/clinics and 52 items for hospitals (Table S2 in the Online Supplementary Document).23 Items included the availability of medicines, commodities, equipment, staff, and systems within the facility to support childbirth care, and recent experience performing key maternal and newborn signal functions. The additional items for hospitals assess availability of neonatal intensive care, cesarean sections, and blood transfusion services not typically provided by lower-level facilities in Ethiopia’s tiered health care system. Of note, item selection for this validated readiness index was guided by the WHO Standards for improving quality of maternal and newborn care in health facilities and captures key readiness elements of the three “provision of care” standards (evidence-based practices, information systems, referral systems) and two “cross-cutting” standards (human resources, physical resources) in the WHO framework.24,25
The availability of medicines, commodities, and equipment was visually confirmed by a trained PMA-ET enumerator and, when relevant, equipment was assessed as functional or not. The head of the facility or designated authority reported on the availability of staff, systems, and performance of signal functions. Each item in the index was coded as 0 ‘no’ or 1 ‘yes’ to indicate whether the item was observed on the day of the assessment, whether the function was reported as performed, or whether the system was reported as being in place. Items were then aggregated by summing the number of available items and dividing by the total number of possible items to compute a summary score ranging from 0 to 1. Each item was given equal weight. The few instances (<1%) where a response was missing or where interviewees responded ‘don’t know’ for any given item were coded to 0. To aid the interpretation of results, readiness scores were categorized in terciles—low (<0.75), moderate (0.75-0.89), and high (≥0.90)—for descriptive analyses or as a binary measure—service-ready (≥0.75) or not (<0.75)—for regression models.
Statistical analysis
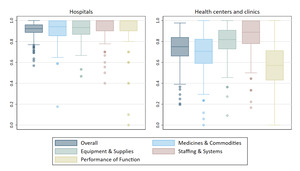
We calculated summary statistics for childbirth service readiness scores, separately for hospitals and health centers/clinics. We also explored variation in the availability of individual items that comprise the readiness index and compared differences in readiness domain sub-scores using box plots. Readiness domains include (a) medicines and commodities for childbirth care, (b) equipment, supplies, and amenities, (c) staffing and systems for ensuring care quality and patient safety (e.g., performance monitoring team, maternal death reviews, emergency transport ), and (d) performance of maternal and newborn signal functions in the three months prior to the survey.
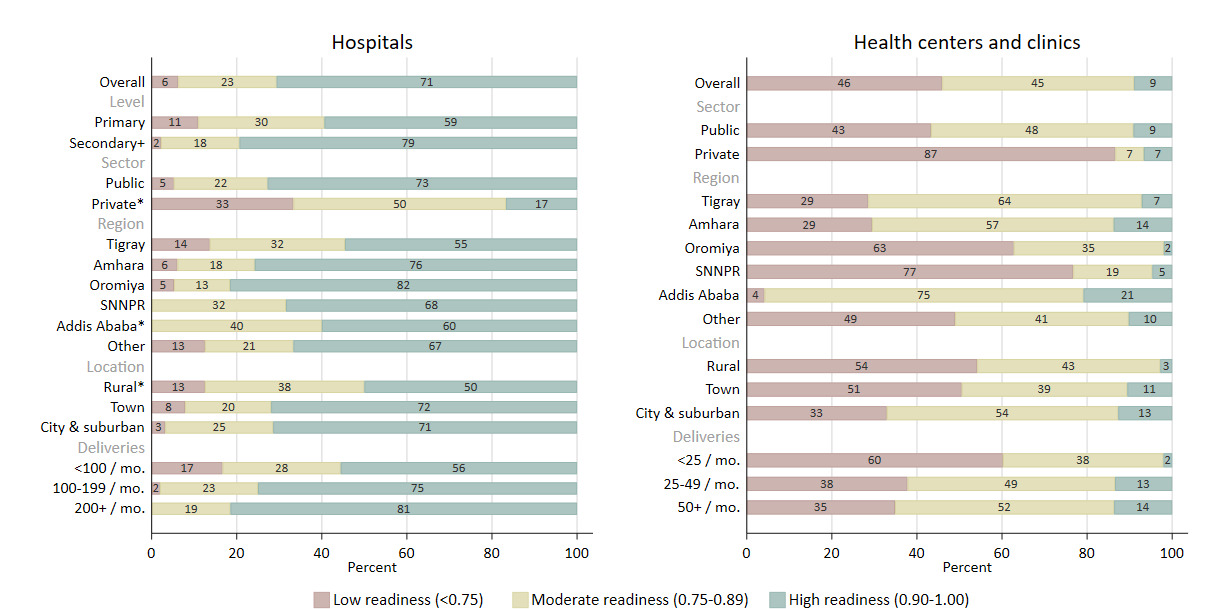
We examined differences in childbirth readiness scores by the following facility characteristics: managing authority (i.e., public or private); region; urbanization (i.e., city, suburban, town, rural); deliveries in the last month; and availability of comprehensive RMNCH services (i.e., facility offers all of the following seven services: family planning, antenatal care, postnatal care, postabortion care, laboratory testing, immunization services, and sick child care). For hospitals, we also examined differences by level of care (i.e., primary or secondary/tertiary); teaching hospital status; and number of cesarean sections in the last month. We estimated differences in mean childbirth readiness scores separately for hospitals and health centers/clinics, fitting resistant linear regression models to limit the influence of extreme values with bootstrapped standard errors to account for skew and unequal variance. Postestimation commands predicted the marginal score means at the average of the covariates. We used bar graphs to visualize the distribution of health facilities with high, moderate, or low readiness, by each of these facility characteristics.
Next, we estimated the odds of a woman residing within 5 and within 10 kilometers (km) of a facility with at least a moderate (i.e., 0.75 or higher) childbirth service readiness score, by population characteristics using univariable and multivariable logistic regression models. The 0.75 threshold was selected conservatively to approximate a minimum standard of readiness. Education, wealth, and place of residence were highly correlated; multivariable models examined the effects of socioeconomic variables (i.e., education and wealth) on the odds of residing within the designated distance of a service-ready facility after controlling for location (i.e., place of residence and region). These analyses were limited to government facilities, because use of private facilities for childbirth services is still relatively rare in Ethiopia outside the capital, Addis Ababa.26
Lastly, we fit univariable and multivariable logistic regression models to assess the association between giving birth in a health facility based on the childbirth service readiness scores of nearby facilities. These analyses were limited to the sub-population of female respondents who gave birth in the two years preceding the survey (n=1,379). The multivariable models controlled for distance to the nearest facility, parity, age, education, wealth, religion, place of residence, and region; models were tested for multicollinearity and adjusted as appropriate. For women who reside within 10 km of more than one government health facility, we defined the independent variable using the highest childbirth service readiness score among these facilities; for women who reside further than 10 km from a government health facility, we defined the independent variable using the readiness score of the nearest. We used a 10 km radius based on evidence that many women are willing to travel farther than the nearest health facility to access care, with typical distances of 7-10 km and sometimes farther reported in different Sub-Saharan African contexts.27–31 Use of a 10 km radius for linking household survey and health facility data has also shown good agreement with exact matching techniques.32 Sensitivity analysis ran the same models using a 5 km radius.
Analyses of linked household and SDP data were weighted to account for the complex survey design and variances adjusted using the Taylor linearization method to account for clustering within EAs. All analyses were conducted using Stata version 15.33
Patient and public involvement
Patients were not involved in the research. A Project Advisory Board, chaired by the Deputy Minister of Health, and composed of representatives from the Federal Ministry of Health, professional associations, multilateral organizations, non-governmental organizations, and donors provided input during survey design and development. The Project Advisory Board advises PMA-Ethiopia on data analysis, utilization, and dissemination.
RESULTS
Of the 406 facilities providing childbirth services in the sample, the vast majority are managed by government entities: 96.3% of hospitals and 93.9% of health centers and clinics (Table S3 in the Online Supplementary Document). Most hospitals are concentrated in towns (55.6%) or cities (36.9%), whereas health centers and clinics are more evenly distributed across rural areas (29.3%), towns (38.6%), and cities (26.4%). Among women responding to the survey (n=8,837), two-thirds (67.3%) reside in rural areas and three-quarters (74.4%) have less than a secondary education. The majority of both women and facilities are located in the more populous regions of Oromiya, Amhara, and the Southern Nations, Nationalities, and Peoples’ Region (SNNPR).
Readiness of facilities offering childbirth services
Hospitals had a median childbirth service readiness score of 0.92 (interquartile range, IQR: 0.88 to 0.96) (Figure 1, Table S4 in the Online Supplementary Document). The majority reported meeting all staffing requirements (i.e., skilled birth attendant on call 24-hours, at least one staff trained in anesthesia, adequate ratio of skilled health personnel to delivery volume) and having all systems for ensuring care quality and patient safety. Most hospitals also report performance of all ten signal functions assessed with the readiness index in the three months prior to the survey; among those that did not, the least performed function was blood transfusion (Table S2 in the Online Supplementary Document). Availability of medicines, equipment, and other supplies was generally high, although most hospitals lack at least a few items—most frequently chlorhexidine, benzathine benzylpenicillin, pulse oximeters, and incubators. Minimal variation in readiness was seen across hospitals. However, both the hospital level (primary vs. secondary/tertiary) and region showed small but significant correlations with service readiness (p=0.01 and p<0.05, respectively; Figure 2, Table S5 in the Online Supplementary Document).
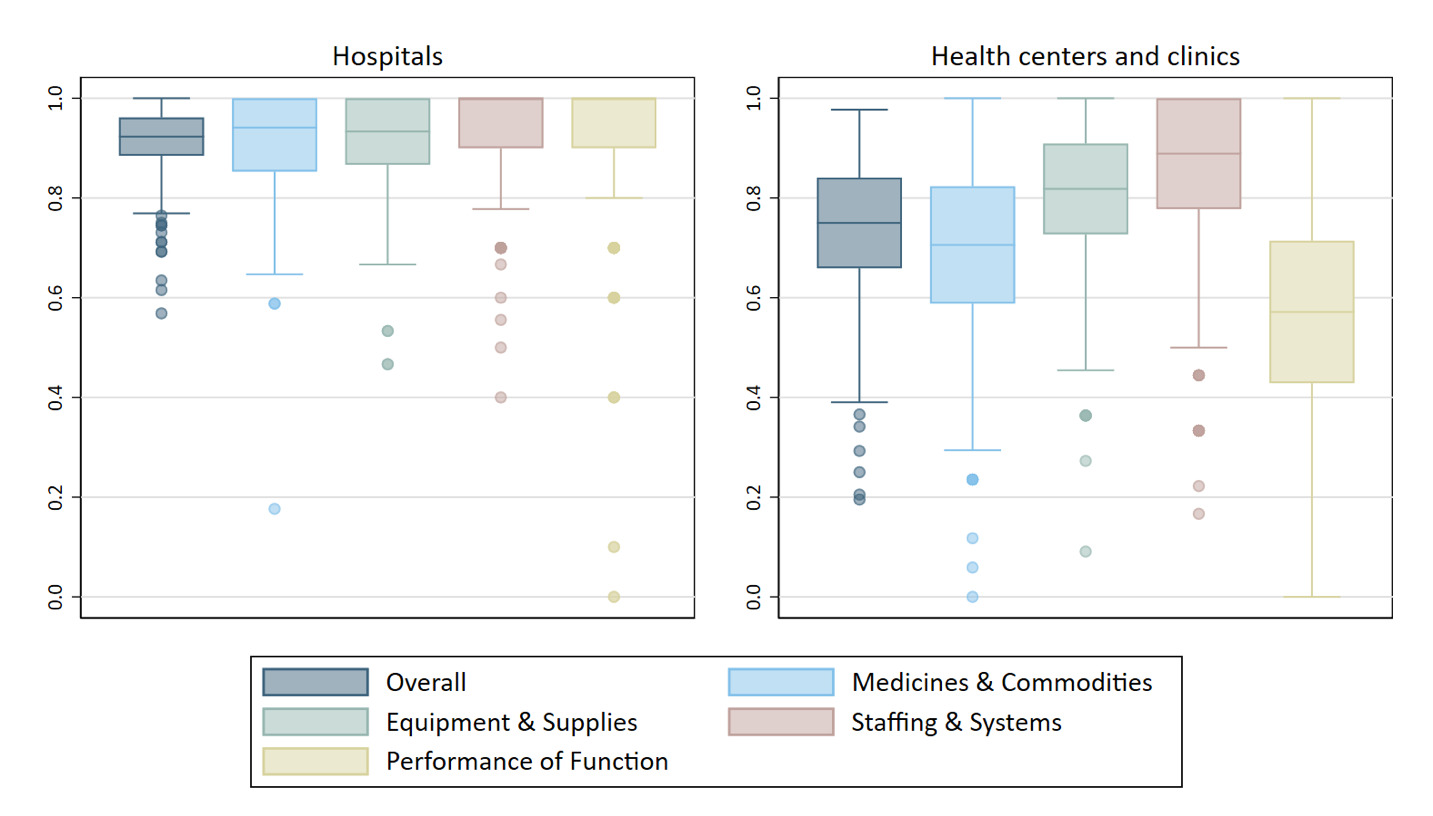
Relative to hospitals, health centers and clinics had a lower median childbirth service readiness score: 0.75 (IQR: 0.66 to 0.84) (Figure 1, Table S4 in the Online Supplementary Document). The weakest readiness domain was past performance of signal functions (Table S2 in the Online Supplementary Document). Stockouts of medicines were common, with most health centers missing 5 or more of the 17 maternal and newborn health medicines assessed on the day of the survey. Additionally, more than one-third of health centers were missing a self-inflating bag and appropriately sized masks for neonatal resuscitation, and only half had access to an ambulance or vehicle on-site for emergency transportation.
Readiness levels of health centers and clinics varied significantly based on facility characteristics (Figure 2, Table S5 in the Online Supplementary Document). Mean service readiness scores were higher in facilities managed by government authorities (vs. private), health centers (vs. clinics), located in cities and suburban areas (vs. rural areas), with higher monthly delivery volume (<25 vs. 50 or more deliveries), and with comprehensive (vs. not) RMNCH services (all p-values <0.05). Service readiness was highest for health centers and clinics located in Addis Ababa and lowest for those located in SNNPR and Oromiya.
Population access to service-ready childbirth facilities
Distance to childbirth services varied widely by women’s socioeconomic and geographic characteristics (Figure S3, Table S6 in the Online Supplementary Document). The median distance to the nearest government facility offering childbirth services was 2.91 km (95% confidence interval, CI: 2.34, 3.47). However, the median distance was approximately five times greater for rural women (4.68 km, 95% CI: 3.76 to 5.60) compared to urban (0.98 km, 95% CI: 0.72 to 1.23) and for the poorest women (5.62 km, 95% CI: 4.34 to 6.90) compared to the richest (0.98 km, 95% CI: 0.72 to 1.24). These disparities were even greater for the distance to reach higher levels of care (i.e., hospitals) that offer comprehensive obstetric and newborn care (Table S7 in the Online Supplementary Document). Across regions, women in Addis Ababa traveled the shortest distance to reach facility childbirth services and had access to multiple facilities, both hospitals and health centers, offering childbirth services within 10 km.
Overall, 62% of women (95% CI: 56%-68%) resided within 10 km of a government facility that is “service-ready” (i.e., had a childbirth service readiness score of at least 0.75), and 43% of women (95% CI: 37%-48%) resided within 5 km. The odds were significantly greater for women with higher levels of education, with greater wealth, and who reside in urban areas (Table 1, Table S8 in the Online Supplementary Document). All respondents in Addis Ababa resided within 5 km of a service-ready facility, and access to a service-ready facility was also better for respondents in Tigray and Amhara. After controlling for location (i.e., place of residence and region), women’s education and wealth remained significant predictors of access to a childbirth service-ready facility. Since residence in Addis Ababa perfectly predicted access to a service-ready facility, the multivariable model automatically dropped Addis Ababa residents. Sensitivity analyses checked whether this exclusion changed inferences for other covariates; wealth remained a strong predictor of access in the sensitivity analyses, whereas education had a weaker association (Table S9 in the Online Supplementary Document).
Association between readiness and utilization of childbirth facilities
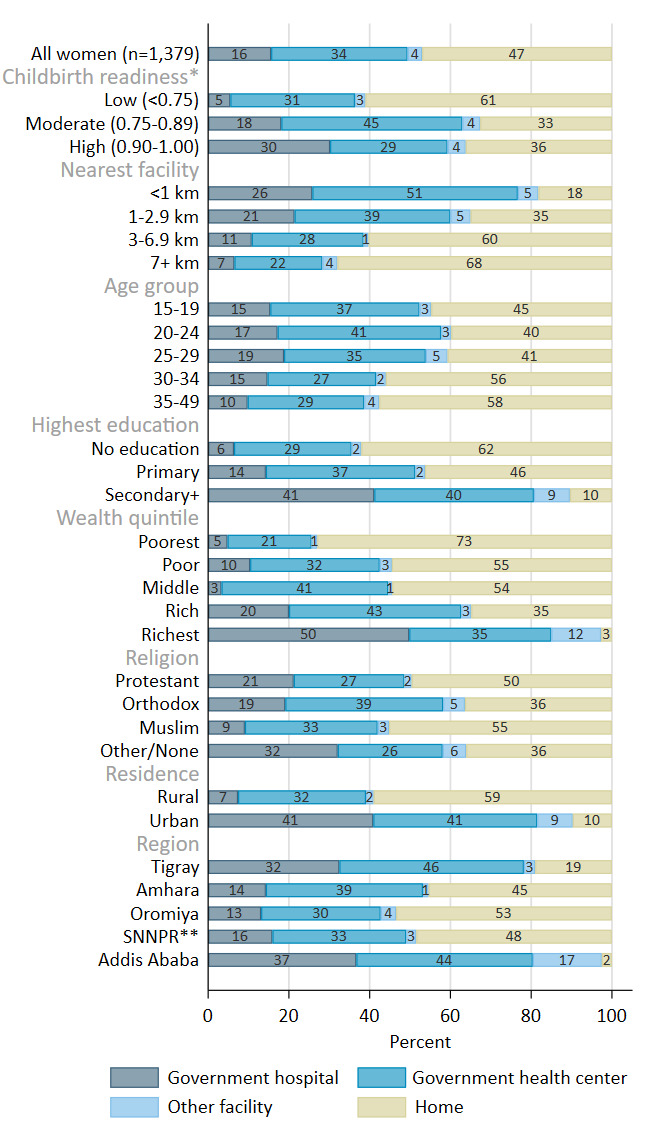
Among women who gave birth in the past two years (n=1,379), 33.8 (95% CI: 28.1, 40.1) percent delivered in a government health center, 15.6 (95% CI: 12.5, 19.3) percent in a government hospital, 3.6 (95% CI: 2.2, 5.7) percent in another type of health facility, and 47.0 (95% CI: 40.3, 53.8) percent did not deliver in a health facility (Figure 3, Table S10 in the Online Supplementary Document). Delivering at a health facility was more common for women who lived within 10 km of a facility with a moderate or high readiness scores (vs. low), and for those who lived a shorter distance to the nearest facility. In unadjusted analyses, the odds of delivering in a health facility (vs. not a health facility) were 1.33 (95% CI: 1.12-1.57) times greater for each 0.10-unit increase (on the 0-1 scale) in the readiness level of nearby childbirth facilities (p-value=0.001) (Table 2). Use of facility childbirth services was also associated with distance to the nearest facility, parity, age group, education, wealth, religion, place of residence, and region. The adjusted multivariable model shows these variables partially account for the observed relationship, attenuating—but not eliminating—the association between service readiness and use of facility childbirth services. After controlling for these covariates, the adjusted odds of delivering in a health facility were 1.23 (95% CI: 1.03, 1.48) times greater for each 0.10-unit increase in the readiness level of nearby childbirth facilities (p-value=0.03). Sensitivity analysis showed similar odds of delivering in a health facility given the readiness levels of nearby facilities when using a 5 km radius, compared to a 10 km radius, for determining the highest score among nearby facilities (Table S11 in the Online Supplementary Document).
DISCUSSION
Access to health facilities ready to provide safe, effective childbirth care varies widely for women in Ethiopia. Women residing in rural areas—who also tend to be poorer and have less formal education than their urban counterparts—must travel farther to reach a health facility that offers childbirth services, and those facilities are, on average, less prepared to offer care than the facilities serving mostly urban populations. Women in urban areas can choose from a wider selection of nearby childbirth facilities of different levels as most of them reside within a few kilometers of both government hospital(s) and health center(s). Consistent with greater access, a higher proportion of urban women deliver in health facilities, with roughly an equal proportion delivering in hospitals relative to health centers. In contrast, most rural women deliver at home, and among those who deliver in a facility, nearly all do so in a health center—often the only facility offering childbirth care nearby. Together, the greater distances and lower readiness of facilities serving predominantly rural and poor populations exacerbate inequities in access and use of quality childbirth care.
Effective coverage of childbirth services (i.e., service use that results in positive health gains) relies on both supply and demand factors, namely the availability of quality care and service utilization.34,35 However, research that seeks to quantify the relationship between facility readiness and use of facility childbirth services has produced mixed results.30,36–40 Our findings are suggestive of a positive association between readiness and use of facility childbirth services. This aligns with two previous studies conducted in Ethiopia36,37 and another in Zambia38 that found significant associations between readiness and use of childbirth services (p<0.05 across all studies). Related research on service use patterns and preferences similarly suggest readiness is an influential factor in determining where women deliver and their satisfaction with care.27–29,31,41,42 However, results from studies in Ghana and Malawi are less clear on this question.30,39,40 The studies in Ghana found some indication that readiness increased the odds of facility birth, but the results were not significant in one study,30 and in the other,40 varied based on the definition used. In Malawi, authors found no evidence of an association between level of care and facility delivery.39
The mixed evidence regarding the association between readiness and utilization may stem from differences in measuring readiness and criteria used for determining which facilities to include in analyses (e.g., the nearest facility or all facilities within a specified distance of women’s residence).23,43–45 It could also reflect true differences in preferences across contexts; in some contexts, women may prefer delivering at any facility, even if they perceive the facility as inadequately prepared, whereas in other contexts, a home birth is preferrable to giving birth at a facility lacking the necessary staff, medicines, and equipment. Finally, the practice of bypassing childbirth care at the nearest facility provides another plausible explanation for the weaker than expected association between readiness and utilization observed in some contexts. Research has shown that women are willing to travel farther to access a higher-level facility or a facility they perceive as offering better care.27–31 Therefore, the readiness of nearby facilities may be more important in determining how far a woman travels to access care rather than whether she uses a facility or not for childbirth. A strength of our study is that we consider the broader service environment accessible to women rather than that at the nearest facility alone to analyze the relationship between facility readiness on service utilization.
Over the past two decades, the Ethiopian government has devoted substantial resources to improve the accessibility and quality of maternal and newborn services in the public sector,13,14 and there is evidence of progress in these care process outcomes. A study by Croke et al. provides evidence that the government’s health facility construction program led to an increase in use of childbirth services,46 and Beyene et al. found improvements over time in the readiness of Ethiopian hospitals to offer comprehensive obstetric services.47 However, our results suggest that progress, especially in lower-level facilities, has been uneven. While hospitals in Ethiopia demonstrate high levels of readiness to provide childbirth care, health centers have significant weaknesses with one out of every four health centers lacking more than one-third of the medicines, equipment, supplies, staff, and systems critical to providing quality childbirth care at their level.
To improve provision of childbirth care at lower levels of the health system, we identify three priority areas for action based on our study findings. First, there is need to address the alarmingly high level of stock-outs of essential medicines in health centers—in our study, calcium gluconate, misoprostol, metronidazole, chlorhexidine, and ergometrine were out of stock in approximately half of health centers. Common reasons for delays in refilling stock at health centers, as reported by staff surveyed for the 2016 Ethiopian EmONC Assessment, include stock-outs at the central store, inadequate transportation to health facilities, and administrative difficulties.5 This points to the importance of interventions to strengthen the country’s procurement and supply chain systems. Second, many health centers have limited experience managing labor and delivery complications, with recent performance of key obstetric and newborn functions being the lowest-scoring readiness domain. Simulation training can be a powerful strategy to strengthen capabilities of clinical teams, particularly in settings where delivery volume is low and providers see few cases with complications.48 Finally, our study highlights the need to strengthen referral systems to risk-appropriate care for women presenting at ill-equipped lower-level facilities. We found that only half of health centers have access to a functional ambulance or car on-site for emergency transportation of such women.
Strengths and limitations
A strength of this study is the use of a comprehensive measure of childbirth readiness aligned with the WHO’s quality of maternal and newborn care standards23—these standards were developed through an extensive literature review and expert consultations.24,25 In contrast, previous studies use conventional readiness indices comprised of fewer items and prone to artificially high scores that mask deficiencies that would be apparent if more comprehensive criteria were used.23 Another strength of the study is that linkages between female respondents sampled for the household survey and the surveyed health facilities were deliberately built into the study design.19 Most other studies using linked household and facility data rely on two independent surveys administered at different times and using distinct sampling procedures.
Our study also has limitations. First, generation of a household wealth index is complicated by the distribution of wealth in Ethiopia. Compared to rural households, urban households tend to have a greater number of the assets used to generate the wealth index. Thus, the index tends to categorize most urban households in the wealthiest quintile and does a poor job of differentiating between relative levels of wealth in urban areas. This may explain why we only find significant results when comparing the richest quintile with all others and little differences between the poorest four quintiles. Second, we use straight-line distance for the 10 km buffer that determines which health facilities to classify as “accessible” to women. Straight-line distance does not account for geographic barriers, such as rivers or difficult terrain, that may impede access, and does not consider access to transportation and the actual time required to reach a facility. As a result, our findings may overestimate access for women residing in rural areas where traveling even short distances may be complicated by rough terrain and limited transportation options. A third limitation is the use of government health facilities rather than all health facilities in the areas where women were sampled for household surveys. We analyze access to public sector hospitals and health centers based on government-defined catchment areas, but some women may use private facilities or public facilities outside of their assigned catchment area. We would not expect this limitation to substantially alter results given the limited use of private childbirth facilities outside of Addis Ababa and their overall limited availability outside of dense urban centers. However, access to service-ready facilities in dense urban areas may be better than measured in this study and, by implication, urban-rural disparities may be greater than reported here. Finally, we measure service utilization based on the most recent birth reported by women within the past two years, whereas facility readiness is measured on the day the survey is administered. Since readiness may change over time, this difference in timeframes limits the strength of the inferences we can make about the relationship between readiness and utilization.
Conclusions
In Ethiopia, access to service-ready childbirth care is not equal for all women. Women in rural areas, and those who are poor, must travel farther to reach a facility providing childbirth services, and the nearest facilities serving these women tend to be less prepared to provide care. Achieving equitable access to quality childbirth care will require more than the construction of health facilities in underserved areas. Continued investments to strengthen procurement and supply chains, referral capacity, and competencies of healthcare workers are required. These investments are important to improve facility preparedness to offer safe, quality care and may also encourage greater use of facility childbirth services.
Acknowledgements
The PMA Ethiopia project relies on the work of many individuals, without whom this research would be impossible. Recognition and thanks go to the Ethiopia country team and resident enumerators who are ultimately responsible for the success of PMA Ethiopia.
Ethics statement
Ethics approval was obtained from Addis Ababa University, College of Health Sciences (AAU/CHS) (Ref: AAUMF 01-008) and the Johns Hopkins University Bloomberg School of Public Health (JHSPH) Institutional Review Board (FWA00000287).
Data availability
Data are publicly available at https://www.pmadata.org/data/request-access-datasets.
Funding
This work was supported, in whole, by the Bill & Melinda Gates Foundation [INV 009466]. Under the grant conditions of the Foundation, a Creative Commons Attribution 4.0 Generic License has already been assigned to the Author Accepted Manuscript version that might arise from this submission. The sponsors of the study had no role in the study design, data collection, data analysis, data interpretation, or writing of this article. The corresponding author had full access to all of the data in the study and had final responsibility for the decision to submit for publication.
Authorship contributions
ES developed research aims for this study, performed data analysis, and wrote the first draft, with the critical input and guidance of AC, LZ, SA, and SS. SS, AS, and LZ were responsible for conceptualization, funding acquisition, and project administration as Principal Investigators for PMA Ethiopia, the parent study. SS, AS, and MY supervised data collection. All authors reviewed the final draft and agreed on its content and conclusions. All authors had full access to all the data in the study and had final responsibility for the decision to submit for publication.
Disclosure of interest
The authors completed the Unified Competing Interest form at http://www.icmje.org/disclosure-of-interest/ (available upon request from the corresponding author), and declare no conflicts of interest.
Additional material
Online Supplementary Document.
Correspondence to:
Elizabeth K. Stierman
Johns Hopkins Bloomberg School of Public Health
615 N Wolfe St
Baltimore, Maryland 21205
USA
Email: [email protected]