

Over the past twenty-five years, Tanzania has made significant progress in reducing new HIV infections and averting AIDS-related deaths by expanding prevention, testing, and treatment services. The share of people living with HIV (PLHIV) on treatment in Tanzania has risen from 22% in 2009 to 75% in 2019,1,2 and acquired immunodeficiency syndrome (AIDS)-related deaths have fallen by one-third from 50,700 in 2010 to 27,000 in 2019.2,3 As a result of expanding treatment and intensifying prevention efforts, new infections have dropped by more than one-third from 120,000 annually in 2000 to 77,000 in 2019.2 Current HIV prevalence is 4.8% for adults ages 15-49 years.2
Looking ahead to 2030 and the next phase of its response, Tanzania has committed to reaching epidemic control and achieving the ambitious Fast-Track 95-95-95 targets— by 2030, 95% of persons living with HIV are aware of their status, 95% of persons aware of their status are receiving treatment, and 95% of persons on treatment are virally suppressed.4 To do so, the country will have to address several outstanding challenges and overcome new constraints. One of the most critical is the level of new infections, especially among adolescents 15-19 years of age.5 In addition, while the percentage of PLHIV aware of their status recently rose from 61% in 2017 to 83% in 2019, to reach the 95-95-95 targets testing coverage will have to increase further and those newly diagnosed will have to be linked to treatment.6
The gains of the past decade were enabled by significant growth in HIV spending, mainly driven by international donors. In Tanzania, total expenditures increased from US$466.8 million in 2015 to US$612.0 million in 2017.7–9 The United States Presidents Emergency Program for the AIDS Response (PEPFAR) and The Global Fund to Fight AIDS, Tuberculosis, and Malaria (GFATM) accounted for about 90% of financing from 2015-2017. Going forward, PEPFAR and GFATM have signaled that HIV financial support to Tanzania is likely to fall or flatten. In 2019, PEPFAR declared a 23% decline for the fiscal year 2019 budget in its Country Operational Plan (COP) Planning Letter 2019.10 After an increase in the FY 2020 budget during the COVID-19 pandemic, PEPFAR again reduced Tanzania’s allocation to US$450 million in the FY 2021 COP Planning Letter.11,12 Global Fund officials also signaled in 2019 that they anticipate grant funding will not grow, and Tanzania should prepare for future cuts. This environment is part of a larger global trend in HIV spending.13
In the face of this shifting funding landscape and persisting challenges to reaching Fast-Track targets, the Tanzania Ministry of Health, Community Development, Gender, Elders and Children (MoHCDGEC) and local partners in 2019 requested an update to the HIV Investment Case to inform planning and budgeting decisions by Government and key partners over the next 10 years. Tanzania’s first investment case framework, published in 2016, put forth a vision in which funding for HIV/AIDS would more than double over 10 years and absorb the equivalent of the country’s entire health budget. In contrast, the second investment case conducted in 2019-2020 sought to present a new paradigm for maximizing the impact of every available dollar under highly constrained budgets.
METHODS
Investment case approach
In 2012, the HIV Strategic Investment Framework was launched to guide countries in allocating limited resources for maximum impact.14 The Framework is meant to be a country-led, people-centered package of investment priorities that is based upon robust analysis of the epidemiology, the current response, and the recent scientific evidence.
The investment case methodology is based on modeling and analysis of scenarios which convey possible “future directions” for the HIV response. Through these scenarios, the investment case defines the key policy and financing decisions and underlying assumptions and data; projects the related health impacts for each scenario; estimates the magnitude of resources required to implement the scenario; and assesses the implications for government and donor resource mobilization.
Traditionally, investment cases have relied on coverage-driven scenarios, i.e., “Constant Coverage” (maintaining the program as is), “National Strategy” (implementing the government’s plan, which is often aspirational), and “95-95-95” (achieving global goals which can be ambitious). These coverage-driven scenarios use program targets as inputs and estimate the resource needs to meet these targets. These types of scenarios are used to advocate for more resources by quantifying the resource gap, defined as the difference between current investments and the needed resources to meet the targets. There are many examples of these scenarios from a wide range of countries including the Dominican Republic, Uganda, Namibia, Nepal, and Vietnam.15–18
The coverage-driven scenarios have been useful in an era of robust year on year increases in donor resources and domestic funding. However, to examine realistic options for the current funding environment, investment case analyses must also consider scenarios defined by constrained resources, estimating the maximum coverage and health outcomes that can be achieved within a limited funding envelope by implementing optimization measures. Modeling can help to identify the most promising pathway to maximizing impact while examining the related trade-offs.
Investment cases across Eastern Europe and Central Asia countries, Malawi, and Zimbabwe have started to use resource-constrained scenarios by setting a percentage of the current baseline budget, i.e., 50% or 75%.19–21 The investment case in Tanzania went a step further by calculating the resource constraint using expected levels of domestic and donor funding available in future years.
Scenarios
Based on discussions with the Tanzania AIDS Commission, National AIDS Control Program, and key partners including PEPFAR and the Global Fund, five main scenarios were selected for the investment case – two coverage-driven and three resource-constrained. These scenarios are shown in Table 1.
- Constant Coverage (CC): In this scenario, all interventions, including antiretroviral therapy (ART), were assumed to be maintained at 2018 levels (Table 2). This status quo scenario is useful as a baseline to compare with other scale-up options and estimate the results of inaction.
-
National Strategy (NS): This scenario reflects the ambitious coverage targets contained in Tanzania’s National Multisectoral Strategic Framework IV and Health Sector HIV Strategic Plan IV and informed by the Global Fast-Track Targets.4,22,23 The NS assumes that the HIV program is implemented with no reallocation across services or other efficiency gains.
-
Optimization with Constant Coverage Funding (O-CCF): This best-case scenario assumes that total funding is maintained at current levels and explores how efficiency measures can maximize the impact that could be achieved.
-
Optimization with Declining Donor Funds (O-DDF): This worst-case scenario assumes that donor funds will continue to decline and domestic financing will remain flat, creating a growing funding gap over time. Efficiency measures are implemented to minimize the impact of the funding gap on health outcomes.
-
Optimization with Domestic Resource Mobilization (O-DRM): This scenario is a hybrid in which external financing declines as in the O-DDF scenario, but the government steps into the breach to mobilize additional national funds to offset the majority of the shortfall.
An additional summary of assumptions behind each scenario is available in Online Supplementary Document, appendix II.
Scenario intervention coverage targets
The CC scenario assumes all interventions remain at 2018 baseline coverage levels. The NS assumes that intervention coverage increases from 2018 levels to the targets established in the National Multisectoral Strategic Framework (NSMF IV) 2018/19 – 2022/23, a key guiding document aligned to reaching Fast-Track targets by 2023.23 Coverage levels were then projected out to 2030. Targets for the CC and NS are outlined in Table 2.
For the resource-constrained scenarios, the Goals model was used to calculate the coverage for each intervention based on the budget available, divided by the assumed unit cost and following the optimization algorithm. ART coverage was maintained at CC levels as long as possible under declining funding envelopes.
Financing for resource-constrained scenarios
Key data sources included the National AIDS Spending Assessment (NASA) 2013/2014 and 2014/2015, GFATM Funding Request 2016, GFATM expenditure data 2011-2016, PEPFAR COPs, PEPFAR COP planning letters, and PEPFAR expenditure data 2014-2018.8,9,24–30
Total HIV expenditure grew from US$466.8 million in 2015 to US$612.0 million in 2017, the most recent year for which all data were available at the time of the analysis. PEPFAR and GFATM accounted for about 90%8,9 with an estimated domestic contribution of US$52.3 million in 2017, less than 10% of total HIV expenditure.7
For the O-CCF scenario, it was assumed available funding from domestic and external sources would remain sufficient to maintain 2018 coverage levels. Since the absolute number of PLIHV on treatment grows over time due to new infections and population growth, annual funding rises slightly from US$461 million in 2019 to US$500 million in 2030, resulting in a cumulative amount of US$5.5 billion over this period.
Based on interviews and review of recent donor planning documents, for the O-DDF and O-DRM scenarios, it was assumed that PEPFAR funding would fall 15% over each 3-year period from 2019 to 2030. It was further assumed GFATM grant financing would decline by 10% during each 3-year replenishment cycle through 2030. These combined losses in donor funding were estimated at over US$800 million from 2019 to 2030, resulting in cumulative funding of about US$4.5 billion in the O-DDF scenario, with annual available funding declining from US$456 million in 2019 to US$324 million in 2030.
For the Domestic Resource Mobilization scenario (O-DRM), it was assumed that the Tanzania Government has the capacity to raise an additional US$3-14 million per year from now until 2030, implying a 4-7% increase in the Ministry of Health budget allocation for HIV. On average, this would amount to an additional US$10.8 million per year. At the time of this analysis, this increase was considered feasible given gross domestic product (GDP) growth was 7% in 2016 and was projected to increase to 7.3% in 2020.31 From 2020, it was projected GDP growth would slow by 0.25% per annum to 4.8% in 2030. This pace of domestic resource generation would raise public sector financing from US$55 million in 2018 to US$174 million in 2030, substantially offsetting donor declines in funding. Cumulative total funding would be about US$5.2 billion, 95% of the O-CCF scenario.
Additional information on financing assumptions can be found in Online Supplementary Document, appendix III.
Optimization approach
Optimization of the resource-constrained HIV envelopes was built on a mix of three strategies: 1) improving allocative efficiency of prevention interventions, 2) maximizing technical efficiency of ART delivery, and 3) employing targeted testing strategies.
1. Allocative efficiency of prevention interventions: Given the large number of prevention interventions being implemented, cost-effectiveness analysis was used to identify opportunities to shift funding across interventions to maximize the number of infections averted per dollar spent. The interventions included: voluntary medical male circumcision (VMMC), condoms, mass media and community mobilization (BCC), outreach and PrEP for people who inject drugs (PWID), men who have sex with men (MSM), and female sex workers (FSW), and cash transfers and PrEP for adolescent girls and young women (AGYW).
Interventions were prioritized based on cost per infection averted, determined using the Goals model. To generate the optimal mix of interventions, the prevention budget was allocated to prevention interventions in order of cost-effectiveness. Each intervention’s coverage was maximized before the subsequent intervention was funded. Equity overrode cost-effectiveness criteria in the case of cash transfers for AGYW and outreach for MSM and PWID, for which coverage was maintained at least at 2018 program levels. See Online Supplementary Document, appendix V for a full description of the methods.
2. Reducing costs of ART delivery (technical efficiencies). Measures to reduce the cost of treatment per patient can also lead to significant savings, since ART accounts for more than half of HIV spending in Tanzania.8,9 The technical efficiencies modeled in the IC 2.0 included:
-
Switching to Dolutegravir (DTG)-based ARV regimens: DTG-based regimens were registered and in use in Tanzania at the time of this Investment Case analysis but had not been scaled nationally. At baseline, the average annual cost of first line ARVs for adults was US$91 per patient (without DTG).32 However, Tanzania would be eligible to order a fixed dose combination of tenofovir, lamivudine and dolutegravir (TLD) as part of a new global price agreement at a projected annual price of US$75 per person,13 resulting in savings of about US$16 per patient per year.
-
Simplified lab testing algorithm: Differentiated service delivery models (DSDM) allow for stable patients receiving care to have both longer ARV prescriptions and simplified lab algorithms,25 including forgoing annual CD4, clinical chemistry, and hematology lab tests and reducing viral load testing to once annually. Streamlining lab testing would save an average of US$14 per patient per year.33
-
Community-based support services for stable patients: These services include peer and group support to improve adherence, treatment literacy, and follow-up and provide well-being checks. Shifting patients from facility-based to community-level support services could save an average of US$20 per patient.34 The most updated report at the time of the investment case suggested that no patients in Tanzania were receiving exclusively community-based support services,35 pointing to the possibility of scaling these services substantially.
More details on these technical efficiencies, including assumptions on how they would be scaled up over time, are in the Online Supplementary Document, appendix VI.
3. Most efficient testing strategy. In 2017, annual expenditure on HIV testing and counseling was about US$50 million, but only 61% of PLHIV were aware of their status. To identify the most cost-effective testing strategy to reach the first target in the cascade (95% of PLHIV are aware of their status), a new Goals HIV Testing model was utilized to compare different combinations of testing modalities (Online Supplementary Document, appendix VII). This module uses previous testing yield data and unit costs to assess the cost-effectiveness of voluntary counseling and testing (VCT), provider-initiated testing and counseling (PICT), community-based screening, and self-testing targeted at specific population groups. It then identifies the most cost-effective combination of testing modalities to reach the 95% testing target.
Epidemiological modeling
The modeling software Goals-Spectrum was used to assess the impact of the five scenarios. Goals-Spectrum is well known in Tanzania and has been used for previous modeling exercises. More information on Goals-Spectrum is available in Online Supplementary Document, appendix I.36
Key data sources for epidemiological and program data included AIS 2003/4, HIV/AIDS and Malaria Survey 2007-8, 2011-2012, DHS 2010, DHS 2015-16, THIS 2016-17, Tanzania NMSF for HIV/AIDS 2018/19 – 2022/23, and Tanzania HIV Investment Case, Reference Report 2016.1,3,23,37–41
Cost estimation
Goals was used to estimate the future costs of the scenarios from 2019-2030. The model calculates the cost of achieving specified levels of coverage by multiplying the size of the target population by the expected coverage level and by the unit cost. Unit costs are detailed in Online Supplementary Document, appendix IV.
Unit cost data collection and validation for the Investment Case 2.0 was supported by concurrent work by authors in this study to develop a Tanzania HIV unit cost database drawing from published literature, grey literature, and program data. Information from the Global Health Cost Consortium Unit Cost Study Repository (GHCC UCSR) online was used when Tanzania-specific data were not available.42
RESULTS
The estimated costs and expected impacts of the investment case scenarios are summarized in Table 3.
Constant Coverage
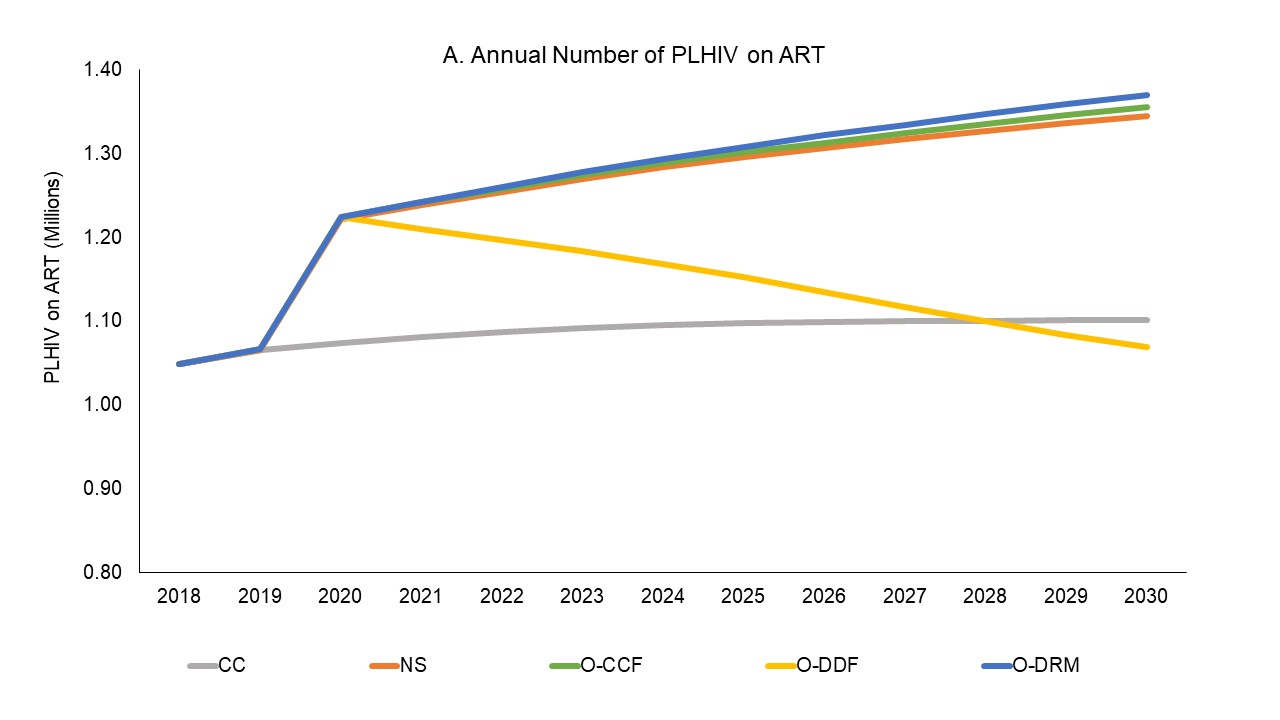
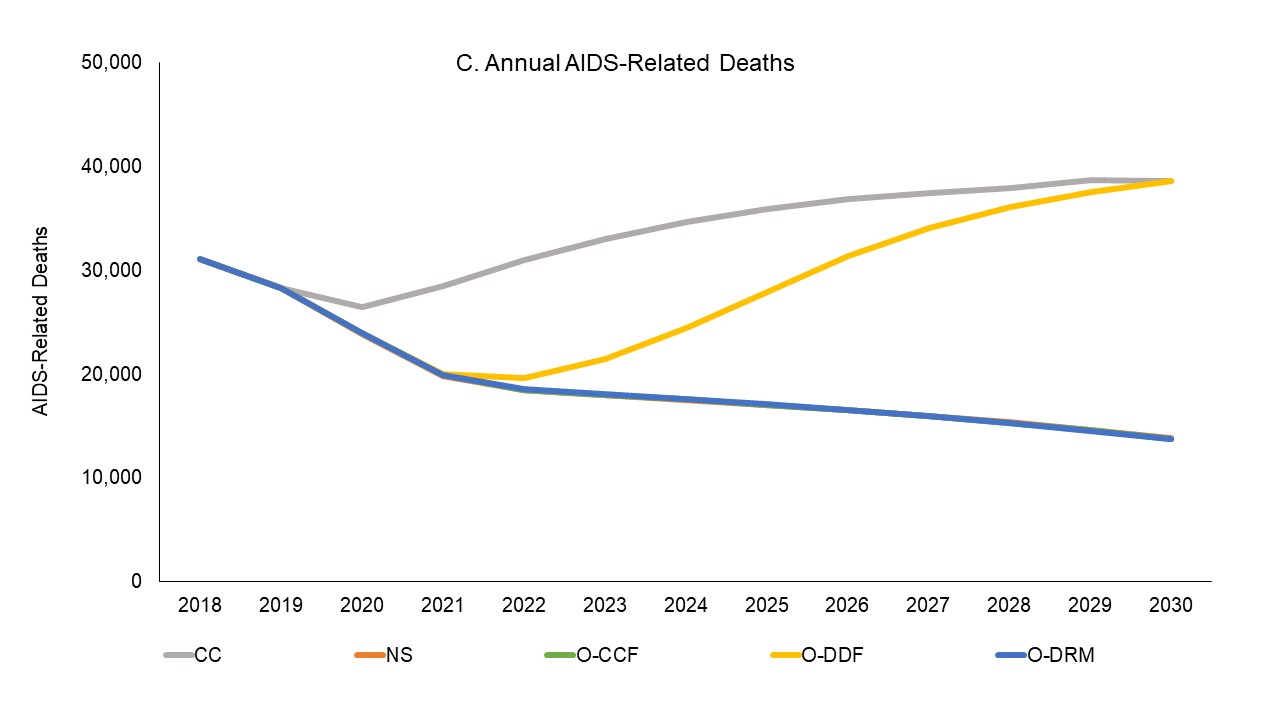
Under the CC scenario, ART coverage would stay constant (Figure 1), the level of new infections would remain stationary (Figure 2), and AIDS-related deaths would increase from 28,000 deaths annually in 2019 to 39,000 annually in 2030 (Figure 3), as a result of stagnating ART coverage. At the same time, Tanzania would spend more than US$500 million a year to fight HIV (Figure 4). Tanzania would see only a 55% reduction in new infections and a 53% reduction in AIDS-related deaths from 2010-2030, substantially below the 90% reduction Fast-Track targets (Table 3).


National strategy (NS)
Implementing the National Strategy would nearly achieve the Fast-Track goals, with an 85% reduction in new infections and an 83% decline in AIDS-related deaths by 2030 versus the 2010 baseline (Table 3). The NS would lead to 255,000 fewer infections and 188,000 fewer AIDS-deaths from 2019-30 compared to the CC scenario. In 2030 alone, the NS would result in 30,000 fewer infections and 35,000 fewer AIDS-related deaths in comparison to CC (Table 3). However, the cumulative cost of the NS would be US$8.1 billion from 2019-30, 40% higher than the cost of CC. By 2030, the annual resource needs would reach US$839 million, almost twice current spending (Figure 4). The funding gap between the CC and NS scenarios would increase from US$48 million in 2019 to US$339 million in 2030.
Optimization
The three optimized resource-constrained scenarios highlight important opportunities for maximizing the impact of available funds. Among prevention interventions, allocative efficiency based on cost-effectiveness would lead to a shift of US$175 million in prevention funding to condoms (~US$15 million), VMMC (~US$130 million), and FSW (~US$50 million). As these specific programs move to scale, less cost-effective interventions would be partially trimmed or held steady to free up additional funds. Community mobilization and mass media (BCC) and PrEP activities would be paused. Cash transfers for AGYW and outreach for MSM and PWID would also be maintained, while FSW outreach, VMMC, and condom interventions would receive more funds. In later years where VMMC coverage becomes saturated, MSM and PWID outreach would be expanded.
On the technical efficiency side, the switch to Dolutegravir-based regimens, simplification of the lab-testing algorithm and using community-based support services for ART are estimated to save US$50 million annually over 2019-30.
The testing efficiency analysis performed suggests that Tanzania can reach the target of 95% of PLHIV aware of their status by 2025 while spending less than today, by focusing on scaling up PITC, VCT, and self-testing through 2022 and keeping PITC and self-testing volumes high when VCT scales back after 2022. In the early years, PITC and self-testing would require 3-4 million tests annually and VCT around 0.8 million tests annually. After VCT scales down, PITC and self-testing volumes would need to rise to 4-5 million tests annually. This would cost US$5 million less each year as compared to the current testing strategy.
Optimization with Constant Coverage (O-CCF)
If the funds for maintaining CC scenario are optimized through implementation of the allocative and technical efficiency approaches described here, O-CCF would avert 243,000 more infections (Figure 2) and 180,000 more deaths as compared with the CC scenario (Figure 3), thus achieving the same impact as the NS for US$2.5 billion less (Figure 4). This scenario would nearly reach the Fast-Track targets with 87% of PLHIV on ART in 2030, an 83% reduction in HIV-related morality, and an 84% reduction in new HIV infections from 2010-30 (Table 3).
Optimization with Declining Donor funds (O-DDF)
Under this pessimistic scenario with declining donor funding and flat financing by the Tanzania Government, from 2019 to 2030 new infections would increase by 7% and AIDS-related deaths would rise by 24% – even if available resources are optimized (Table 3). By 2030, there would be 10,000 more HIV-related deaths each year compared to 2019, a 20% increase. ART coverage for PLHIV would drop from 68% to 65%.
Optimization with Domestic Resource Mobilization (O-DRM)
If the Government were to mobilize an extra US$10.8 million a year from now to 2030 through a combination of MoHCDGEC budget increases, national health insurance resources, and special HIV Fund levies, the increased domestic resource mobilization would substantially offset the expected declines in donor funding. Combined with optimization, the impacts would be similar to the O-CCF and NS scenarios – a decline in HIV-related deaths of 56% from 2019 to 2030 and near achievement of the Fast-Track 2010-2030 mortality targets. Similarly, new infections would drop by 66% from 2019 to 2030 and 82% cumulatively from 2010 to 2030. Cumulative new infections would still be slightly greater than the NS and O-CCF scenarios since steep declines in donor funding would occur before the increases in domestic investments fully kick-in (Figure 2). The share of PLHIV on ART would reach 87% in 2030, just shy of the Fast-Track target (Figure 1).
DISCUSSION
As Tanzania looks to the next phase of its HIV response, difficult decisions will have to be made to enable the country to reach the Fast-Track 95-95-95 targets. There will likely be growing pressure on the HIV budget, as donor commitments become less certain and may decline, a sea change from a decade ago when HIV spending worldwide was increasing by more than 10% year on year.13 At the same time, the government will be facing claims on scarce resources from a wide range of competing infectious and non-communicable diseases, including COVID-19. This will make it challenging for Tanzania to expand and sustain the hard-fought gains in lowering new HIV infections and saving lives from AIDS-related deaths.
The use of resource-constrained scenarios in the updated Tanzania investment case can help frame these difficult policy and financing choices and associated trade-offs. Traditionally, an ambitious national strategy is the scenario emphasized in HIV investment cases. However, the Tanzania National Strategy’s price tag of US$8.1 billion (2019-30) would require doubling annual HIV spending over the next decade to the point where the HIV expenditures would alone exceed the entire current MoHCDGEC budget. By including optimization scenarios in the investment case and comparing these to the NS and CC scenarios, policy makers can consider how to maximize the number of lives saved and new infections prevented for every available dollar.
If donor funding stays at current levels – an optimistic assumption – the O-CCF scenario shows that the NSF targets can be achieved for US$2.5 billion less if optimization is implemented. This would require shifting about US$175 million in prevention resources toward voluntary male circumcision, condoms, and female sex work programs over the next 10 years. In addition, Dolutegravir-based first line regimens, more streamlined lab algorithms for stable patients, and community-based delivery of support services for PLHIV would have to be scaled up. These adaptations in ART delivery would save US$50 million a year over the coming decade. To increase the efficiency of testing, VCT and self-testing should be expanded through 2022, and for the rest of the decade levels of PITC and self-testing should remain high while scaling back VCT.
If donor funds decline at anticipated levels and domestic funds do not rise, even with implementation of the described aggressive optimization measures, the HIV/AIDS program coverage is not sustainable at its current level, as shown in the O-DDF scenario. The human toll would be significant. The share of PLHIV on ART would fall from 68% in 2018 to 65% in 2030 and there would be 10,000 more HIV-related deaths each year in 2030 compared to 2019. Epidemic control would no longer be within sight.
However, the O-DRM scenario shows that this reversal in progress in fighting HIV/AIDS is avoidable if the Tanzanian government increases domestic HIV contributions by an average of US$10.8 million a year over the next decade. If the country mobilizes these extra resources and optimizes their use, it can come close to achieving its Fast-Track goals even with donor support on the decline.
The proposed additional domestic contributions are manageable within the expected fiscal space. In the end, the proposed additional government resources in the O-DRM scenario would raise Tanzania’s domestic share of HIV spending to about 40% of all HIV spending, with donors still financing over half of the HIV response. The most promising mechanisms for mobilizing additional domestic resources include: increasing the MoHCDGEC budget marginally from 10% (2016) to 11% of total government spending and the share of the health budget going to HIV/AIDS from 4.4% (2019) to 7%; funding the new AIDS Trust Fund with a mix of earmarked taxes and voluntary contributions from the private sector; and adding HIV services to the package of guaranteed benefits under the National Health Insurance Fund, as part of Tanzania’s stated move toward Universal Health Coverage (UHC). Modeling suggests that US$660 million of total domestic investment in HIV/AIDS over the period to 2030 would yield an economic benefit of US$4.3 billion for Tanzania.43
This study builds on the traditional investment case methodology but emphasizes scenarios in which total available funding for HIV is plateauing or waning. It uses resource constrained scenarios defined by projected declines in external donor financing, creating a strong motivation for optimization and domestic resource mobilization. Optimization is becoming more widely used in HIV modeling, but country studies rarely utilize precise evidence-based estimates of future available donor and domestic funding. More frequently they either assume no gains in efficiency and show how depressed levels of funding and coverage would result in shortfalls in achieving the targets for lowering infections and deaths,44 or analyze optimization based on arbitrary funding amounts.45 The O-DDF and O-DRM scenarios in the Tanzania investment case presented here are grounded in information and analysis of expected donor financing and domestic fiscal space and also explore the impact of optimization.
This investment case was completed prior to the COVID-19 pandemic. In the COP 2020 Letter,11 following the beginning of the COVID-19 pandemic, Tanzania received an increase in PEPFAR funds, a reversal of the position in the COP 2019 Letter. The Global Fund to Fight AIDS, Tuberculosis, and Malaria also extended additional grants to Tanzania in 2020 as part of its special COVID-19 Response Mechanism. In the 2021 COP Planning Letter, however, PEPFAR again reduced Tanzania’s allocation,12 suggesting that the long-run trend may still be downward. In that case, the approach taken here remains relevant.
In practice, implementing changes in the composition, efficiency, and financing of the national HIV response to achieve optimization of available funding will be challenging. Shifting money from specific areas of prevention to other highly cost-effective services will require dialogue and consensus-building between government and implementing partners and civil society organizations. It will be challenging to expand delivery capacity in the areas recommended for expansion, such as VMMC and female sex worker outreach. Increasing the efficiency of AIDS treatment will also require leadership and coordination among government departments and donor agencies. New policies surrounding viral load testing and community-based adherence support will have to be agreed on and implemented.
This study, like other investment cases, can be used for advocacy with decision-makers in the Ministries of Health and Finance and Planning and the Tanzania Parliament, especially to secure increased domestic resources. To maximize the use of available fiscal space, HIV testing and treatment could be considered for inclusion in the National Health Insurance Fund (NHIF) benefits package, so that a portion of future AIDS spending is covered as part of broader UHC financing. The AIDS Trust Fund, another source of potential domestic revenues, will have to be revitalized and its earmarked levies and private sector contributions collected as originally envisioned. This would make the Trust Fund an important source of funding as in other countries such as Zimbabwe.46 A “shared responsibility” agreement negotiated between the Government and key donors that includes agreed external funding commitments for all parties over the next 3-5 years, matched by growing and predictable allocations from the key domestic sources including the health budget, the AIDS Trust Fund, and NHIF would help bring greater robustness and predictability to Tanzania’s HIV financial plans.
The approach and findings of Tanzania’s second HIV investment case are relevant to the dozens of other countries with large HIV burdens and a high dependency on external financing. The methodology used here for Tanzania can be utilized by applying country-specific data to inform epidemiological modeling, resource needs (cost) estimation, and financing options analysis. At the time of writing this paper, similar resource-constrained scenarios were being developed for Namibia’s second HIV investment case and have subsequently been used in Mozambique’s HIV national strategic plan. Tanzania’s fiscal situation is not unique, with domestic fiscal space similarly constrained in many low- and middle-income countries that face competing health, education, infrastructure, and other social and economic priorities. These fiscal challenges are being further exacerbated by COVID-19. Strategic planning rooted in realistic assumptions about available financing will therefore be critical if these countries are to maximize the number of lives saved and HIV infections averted by making the difficult but necessary decisions to invest in interventions known to reduce new infections the most and to maximize the number of persons living with HIV on treatment at the lowest possible cost.
Limitations
Data definitions and categories for reporting HIV expenditures were not fully harmonized across government and external partners. Study authors and the Bill and Melinda Gates Foundation were actively pursuing a harmonization crosswalk exercise at the time of this study, and these results will help to improve the accuracy of HIV expenditure tracking and future financing estimates. While many behavioral and enabling interventions are recognized as important, their quantitative effects on HIV transmission have not be proven in the literature and thus were not included in the Goals model for purposes of estimating impact.
Data on HIV prevalence and incidence were derived from recent surveys in Tanzania,3 and related assumptions used in the investment case model were agreed upon by the government and UNAIDS during an estimation exercise conducted around the time of the investment case. These epidemiologic data are therefore up to date and can be seen as reliable for the investment case modeling.
Unit cost assumptions were of variable quality. In parallel to the investment case, a team of consultants was updating HIV unit costs for Tanzania, and those data were used wherever possible, an advance on the quality of the cost data incorporated in the first Tanzania investment case in 2016.1 Other unit costs came from various studies reported to the Global HIV Cost Consortium.42 Where Tanzania-specific data were not available or were outdated, comparable unit costs from neighboring countries (e.g., Kenya, Uganda) with similar HIV program conditions and price levels were used. The cost of ART delivery, the largest cost driver, was based on country-specific 2016 data and brought up to 2019 terms, and can thus be considered reliable.31
CONCLUSIONS
The HIV response in Tanzania, as in many other countries, has entered a new phase as the countdown to 2030 begins. In the current environment of constrained donor funding and contested domestic health budgets, Tanzania has an opportunity to optimize the value of every dollar spent, achieving greater impact in preventing new infections, putting more PLHIV on ART, and increasing domestic resource mobilization to offset donor financing reductions. The impact of COVID-19 is creating additional urgency. Under these circumstances, traditional HIV investment case methods can be adapted, as shown in this study, to explore scenarios that take into account severe funding constraints and model the optimization of available funding.
Funding
This study was funded by UNAIDS.
Acknowledgements
This study was commissioned by the Tanzania Commission for AIDS (TACAIDS), the Tanzanian National AIDS Control Program (NACP) within the Ministry of Health, Community Development, Gender, Elderly and Children (MoHCDGEC), and UNAIDS. The authors thank TACAIDS for chairing the Investment Case 2.0 committee and NACP, MoHCDGEC, PEPFAR, and GFATM for their feedback during the conceptualization and validation phases. We also thank all stakeholders who shared their time through participating in informative interviews and validation workshops.
Authorship contributions
LH, SR, CS, JS, SF and RH contributed to study conceptualization. LH, SR, CS, MT, LZ, SM, JS, SF, and RH supported data collection. LH, SR, CS, JS, and SF conducted data analysis. All authors supported data interpretation. RH managed the study. LH and RH drafted the manuscript. All authors reviewed the manuscript.
Competing interests
The authors completed the Unified Competing Interest form at http://www.icmje.org/disclosure-of-interest/ (available upon request from the corresponding author), and declare no conflicts of interest.
Correspondence to:
Lindsey Hiebert, MPH
144 Moreland Ave NE Unit 539
Atlanta, GA 30307