

Nigeria has the largest number of global under-five deaths, and almost half of these occur in the newborn period.1 Birth weight is the main indicator of health outcomes, especially the short-term survival of the newborn. Size at birth may reflect urgent attention because of the significantly increased risk it poses for infants and young children and the risk of developing chronic diseases in adulthood.2 Prenatal and early childhood periods are particularly susceptible to nutrient deficiencies and toxicity of trace elements due to the episodes of rapid growth, relatively low mineral stores at birth, poor intestinal absorption, excess intestinal and renal losses, high vulnerability to oxidative stress, high exposure to a bodyweight, immature metabolic pathways, delicate developmental processes, and numerous life-course effects.3,4 An oxidant/antioxidant imbalance in infants is implicated in the pathogenesis of the major complications of prematurity, including respiratory distress syndrome (RDS), necrotizing enterocolitis (NEC), chronic lung disease (CLD), retinopathy of prematurity (ROP) and intraventricular haemorrhage (IVH).5 Since foetal development depends on genetics, maternal nutrition, and placental circulation,6 environmental and lifestyle modifications over time could have affected our risk of diseases and its overall burden. The environment is continuously and increasingly exposed to heavy metals from anthropogenic sources. In Nigeria, anthropogenic sources of heavy metals include artisanal mining, illegal refining, inadequate disposal of waste, sewage sludge, smelting operations, industrial production and use, domestic and agricultural use of metals and metal-containing compounds, vehicle traffic, the burning of fossil fuels for heating and cooking, construction sites and various industries.7,8 Adverse outcomes in pregnancy, such as foetal loss, retarded foetal growth, congenital anomalies and impaired neurodevelopment, are associated with prenatal Lead and Mercury exposure.9 Although the placenta has been reported to be a partial barrier for cadmium, some studies have presented the harmful health effects of prenatal cadmium exposure.8,10 Many have tried to establish epidemiological relationships between these exposures and alterations in foetal development and to push the need for improved biomarkers of trace element status.11–13 Hitherto, few studies that have evaluated the influence of potential toxic metal on birth outcome in Nigeria have focussed mainly on highly industrialised areas. This study aimed to evaluate the levels of toxic and essential metals in maternal and cord blood and their effects on anthropometric parameters of newborn in a non-industrialised, predominantly agricultural community Abakaliki, Nigeria. To the best of our knowledge, only a few studies on heavy metal levels in Nigerian mother-child pairs, including umbilical cord blood sampling, have been published so far.
METHODS
Investigation area
Abakaliki is the capital of Ebony state, South Eastern Nigeria. It lies at the intersection of roads from Enugu, Afikpo, and Ogoja. An agricultural trade centre (yams, cassava, rice, and palm oil and kernels), the town is located in an area known for its Lead, Zinc, and limestone deposits.
Recruitment and data collection
The study population was 60 pregnant women from the Federal Teaching Hospital in Abakaliki, who agreed to participate in the study. The eligibility criteria to participate in the present study were as follows: living in the study area Abakaliki for at least five years; aged 18 to 40 years and no report of diabetes, hypertension, or preeclampsia. Women were recruited at the 3rd trimester of pregnancy and followed up until delivery. Pregnant women were briefly screened for eligibility, recruited, enrolled, consented (before delivery), and interviewed after delivery by bilingual interviewers in their preferred or native language (English, Igbo) using a standardized questionnaire to collect general information on bio-demographic characteristics (e.g. age, menarche, height), family history of hypertension or diabetes, and lifestyle (e.g. smoking and passive smoking, alcoholic drinking) during pregnancy, and obstetric data. In addition, details on the mother’s family records, including some congenital diseases or prior miscarriages, stillbirth, weight at delivery, birth date, gender, gestation week and birth weight, were obtained from the medical delivery record.
Questionnaire
The robust validity of the questionnaire “Levels of toxic and essential metals in maternal and cord blood and their effects on anthropometric parameters of newborns from Abakaliki, Nigeria” was verified by the experts in Measurement and Evaluation School of public health at the University of Port Harcourt. The questionnaire was administered to them for scrutiny, and their recommendations were affected before they were administered.
Maternal and cord blood collection and pre-treatment
From January 2019 to July 2019, some midwives under a physician’s supervision obtained maternal and cord blood using a standard aseptic technique. Approval for this study was granted by Federal Medical Centre Abakaliki, Ebonyi State Nigeria Health Research Ethics Committee (REC APPROVAL NUMBER 11/07/2018 – 14/09/2018). Maternal blood (2 ml) was extracted via venepuncture using metal-free syringes into a trace metal-free cryovial containing ethylenediaminetetraacetic acid (EDTA) as an anticoagulant at Federal Medical Centre Abakaliki, Ebony State Nigeria, while 2 ml of umbilical blood was collected from the cord using needle and syringe into a trace metal-free cryovial containing ethylenediaminetetraacetic acid (EDTA) as an anticoagulant also. Blood samples were taken for laboratory analysis and then frozen to -80oC and transported using a cold blood chain to Laboratory called Lighthouse Petroleum Engineering LTD at No 6, Lighthouse Road, GRA Effurun Delta State, Nigeria. Prior to analysis, 2 μl of blood samples were digested with 1 μl of concentrated nitric acid (70% nitric acid; Optima grade, Fisher Scientific) overnight at room temperature. The following morning, 2 μl hydrogen peroxide (30% Suprapur grade, Sigma-Aldrich) was added to each digest and allowed to sit overnight at room temperature, stored in the refrigerator until analysis.
Laboratory methods
The dilution and handling of the samples were done following the ultra-clean lab procedure developed for water samples with very low lead levels.14 All lab equipment that came into contact with the sample, in particular, was thoroughly decontaminated. An Agilent 7500c series Inductively Coupled Plasma Mass Spectrometer (ICP-MS) with a collision cell was used to determine the metal content of each sample. The manufacturers’ suggested instrument operating conditions were used. Blood samples were mixed with the chemical cocktail in the sample tubes and pumped directly into the instrument. A reagent blank (diluent without blood), a duplicate sample, and a normal reference blood sample (NIST) 1640 combined with the diluents were used with each batch of blood samples tested. The process detection limit was 0.2 μg/dl, measured as three times the standard deviation for the reagent blanks.
Measurement of Anthropometric Parameters
Anthropometric variables (head circumference, abdominal circumference, birth weight, birth length) of the newborns were measured. Low birth weight was defined as birth weights (<2500 g).13
Statistical analysis
The data were statistically analysed using statistical SPSS package (23.0) version (SPSS Inc, USA). The normality of each variable’s distribution was verified; descriptive analysis was carried out while multiple comparisons were made using Pearson’s correlation. Principal Component Analysis (PCA) was first carried out as a factor reduction technique. Given a relationship between one dependent variable and multiples of independent variables, PCA attempts to identify the most sensitive independent variables, often called principal components, are employed in multiple regression modelling, and the less sensitive variables are discarded. This is economical when sourcing input data to simulate for prediction purposes. The principal components are usually showcased in bold prints after varimax rotation using XLSTAT 2016 software with an inbuilt option called Principal Component Regression (PCA) to develop the regression models.15
Results
1.1 Check for normality in heavy metal concentration in mother blood and baby cord
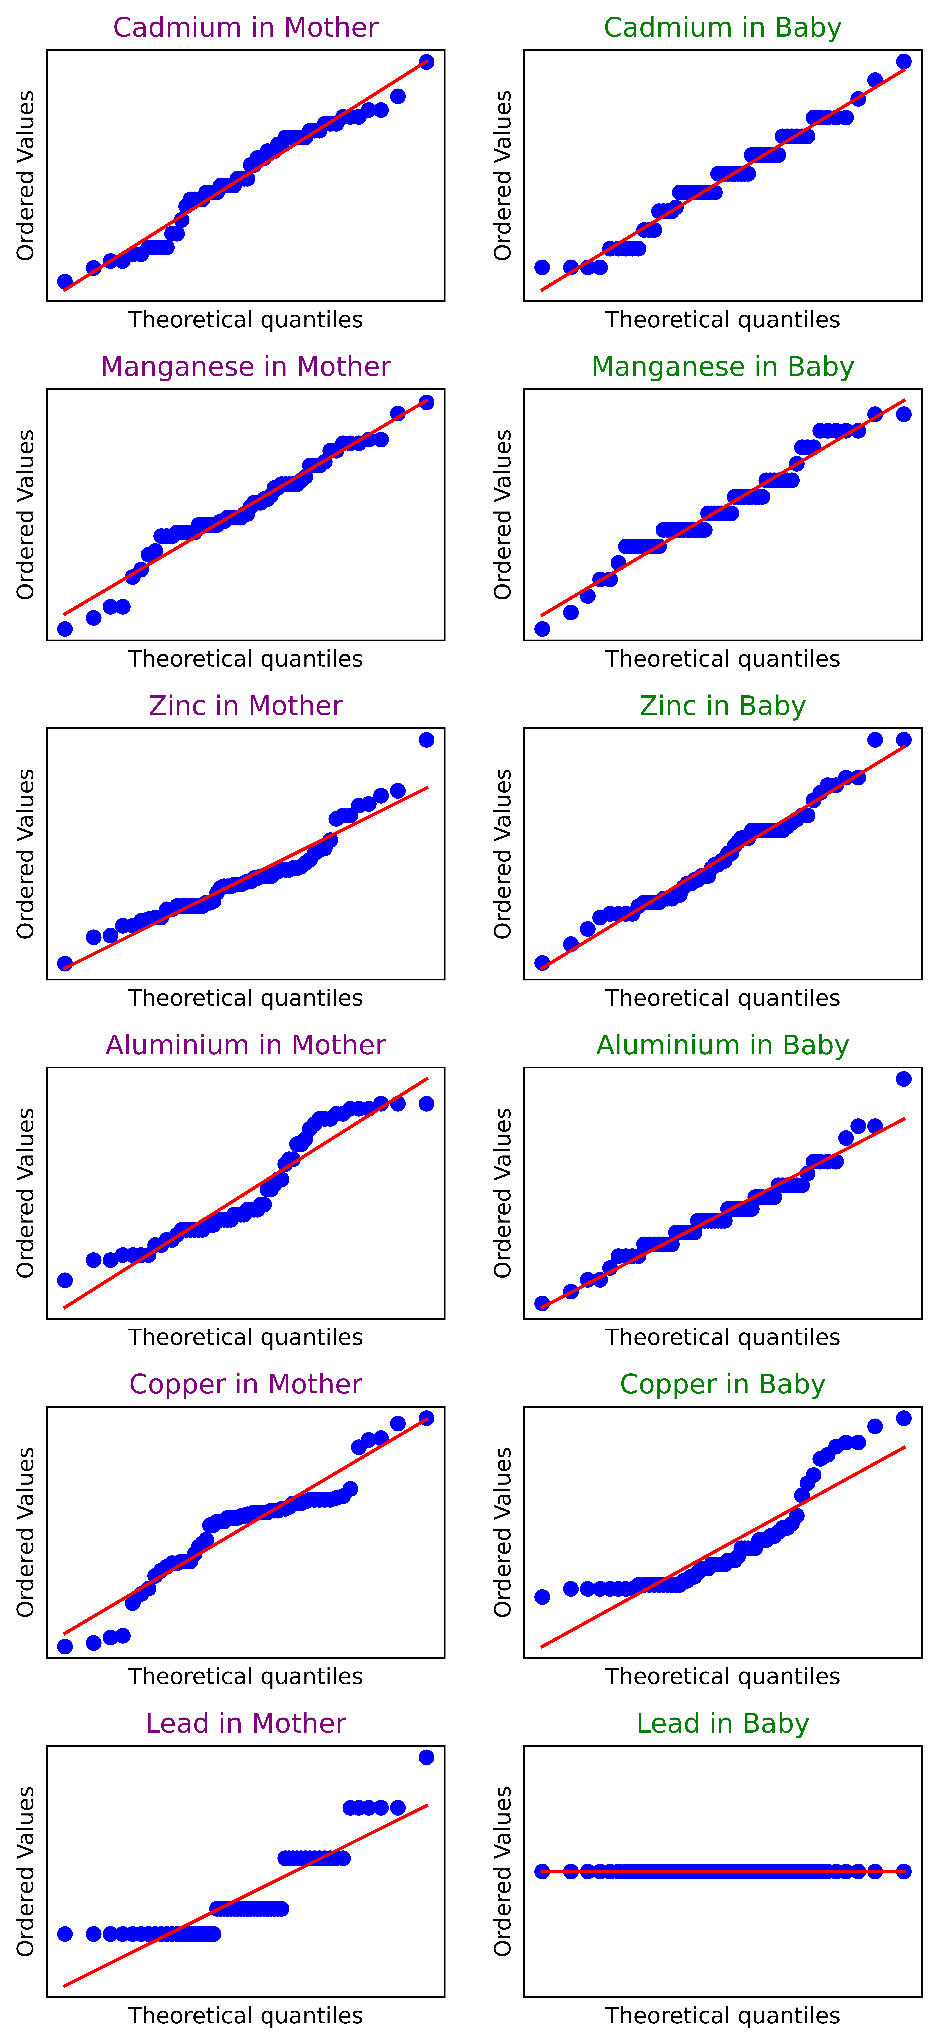
The skewness for the heavy metal concentration in the maternal blood and baby cord was computed, and the result is presented in Table 1. The result showed that most of the heavy metals concentration in both the mother blood and baby cord had some form of skewness (negative or positive). It was observed that copper in the baby cord had the highest positive skewness while Lead metal in the mother blood equally had the highest positive skewness The Q-Q plot, presented in Figure 1, showed clearly that most of the heavy metal concentrations in the maternal blood and baby cord did not fall on the 45o diagonal line. The result from the Q-Q plot showed that the heavy metal concentration in both the mother blood and baby cord is not normally distributed. Thus, both the skewness and Q-Q plots complimented each other.

1.2 Heavy metal concentration in mother and baby cord
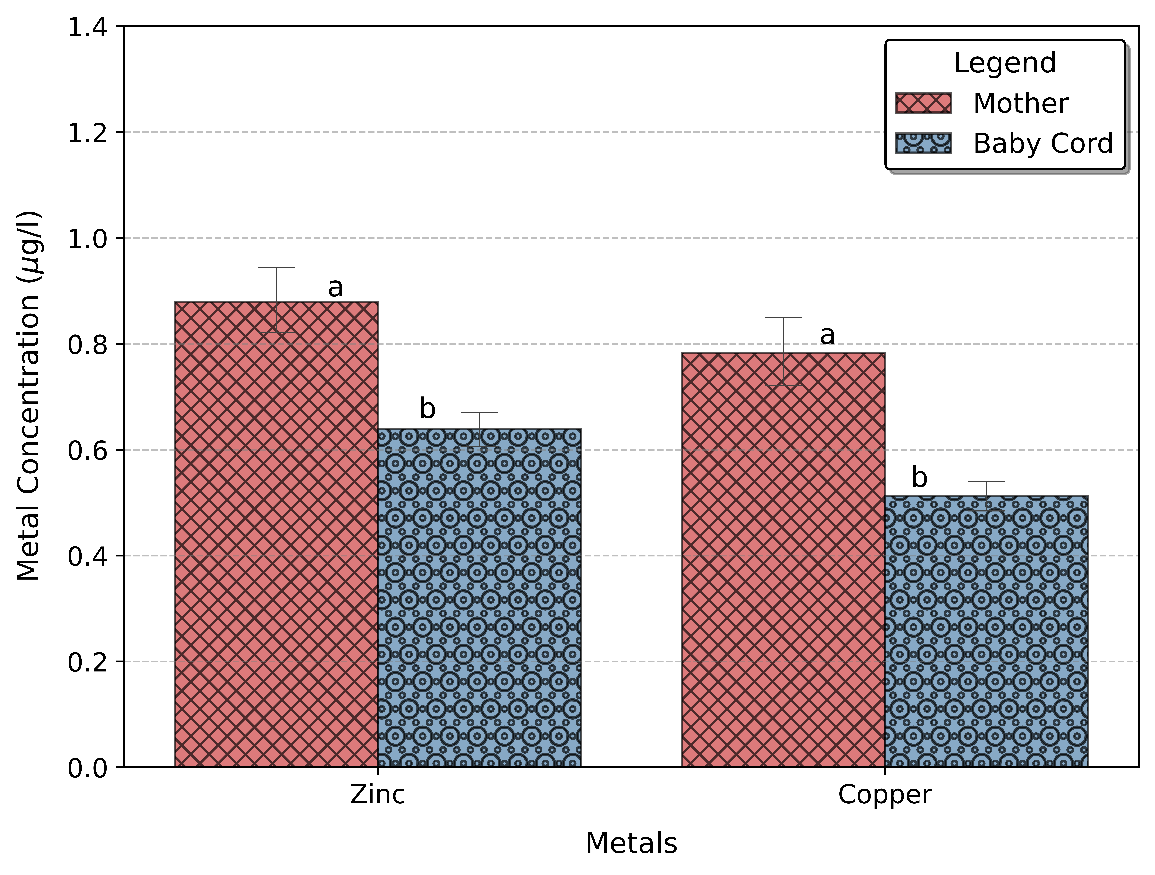
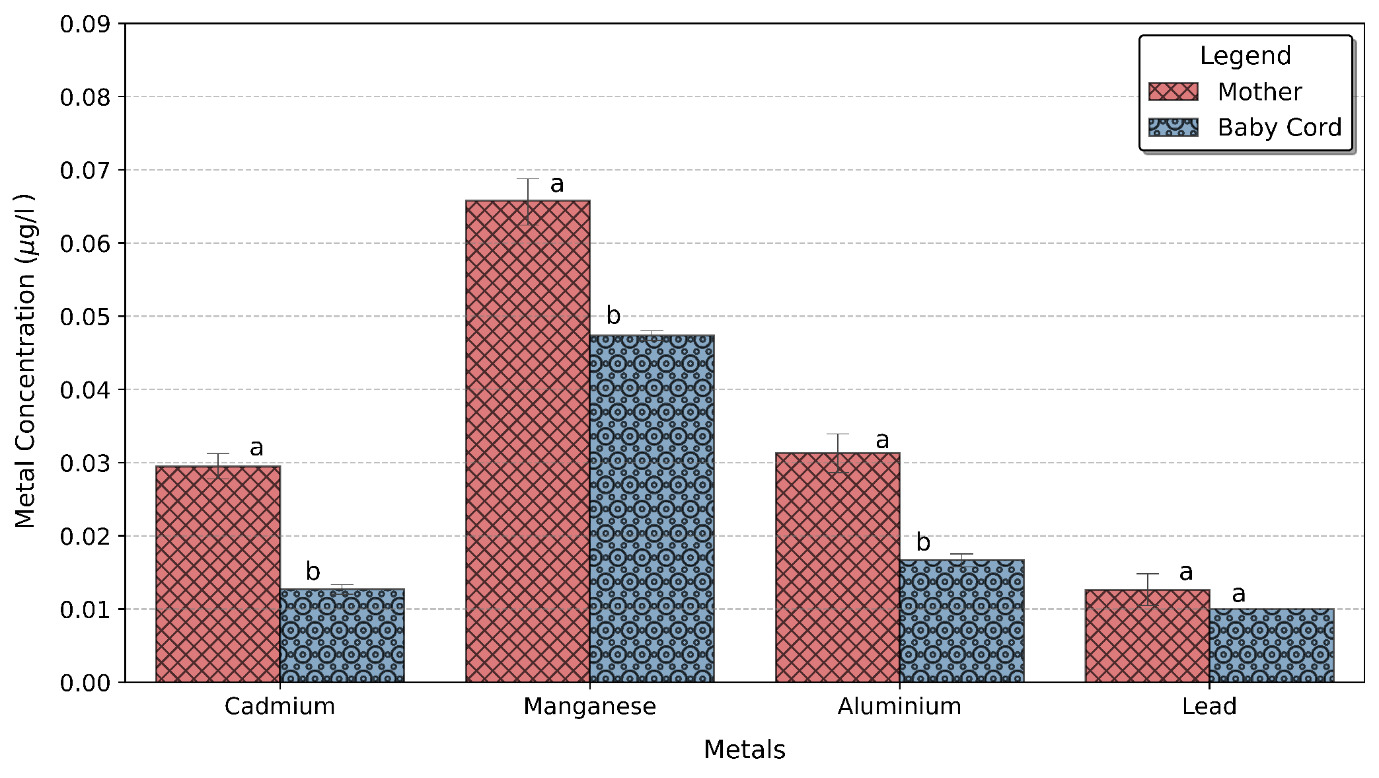
Higher metal concentrations were observed in the mother blood than in the baby cord blood (Table 2). Among all metals analysed, zinc was predominant in both the mother and baby cord blood, followed by copper; a very low concentration of antimony, arsenic, mercury and selenium was found in both the mother and baby cord. Figures 2 and 3 show the level of metals concentration in the mother and baby cord blood. Higher metals concentration were found in the mother blood than in the baby cord blood, this can be attributed to the fact that the pathway for the heavy metal to the baby is mainly through the mother.
The z- test was carried out to check if the difference seen in the metal’s concentrations in the mother and baby cord blood were significant (Table 3a). The test showed that the concentrations of aluminium, cadmium, copper, manganese, and zinc found in the mother blood were significantly higher than those found in the baby cord (protective effect of the human placenta), while the concentrations of antimony, arsenic, lead, mercury and Selenium were not. Noticeably, the community seems deficient in selenium.
The mean zinc concentration in the mother blood was 0.879 μg/l while for the baby cord it was 0.639 μg/l, the result showed that there was a 27% reduction in the amount of zinc transferred from the mother to the baby cord. The mean copper concentration in the mother blood was 0.783 μg/l while in the baby cord was 0.513 μg/l which means a 35% reduction in the amount of copper transferred from the mother to the baby. As expected, cadmium had the highest reduction of metal transfer from maternal blood to the baby cord (Table 3b), with approximately 55% reduction.8
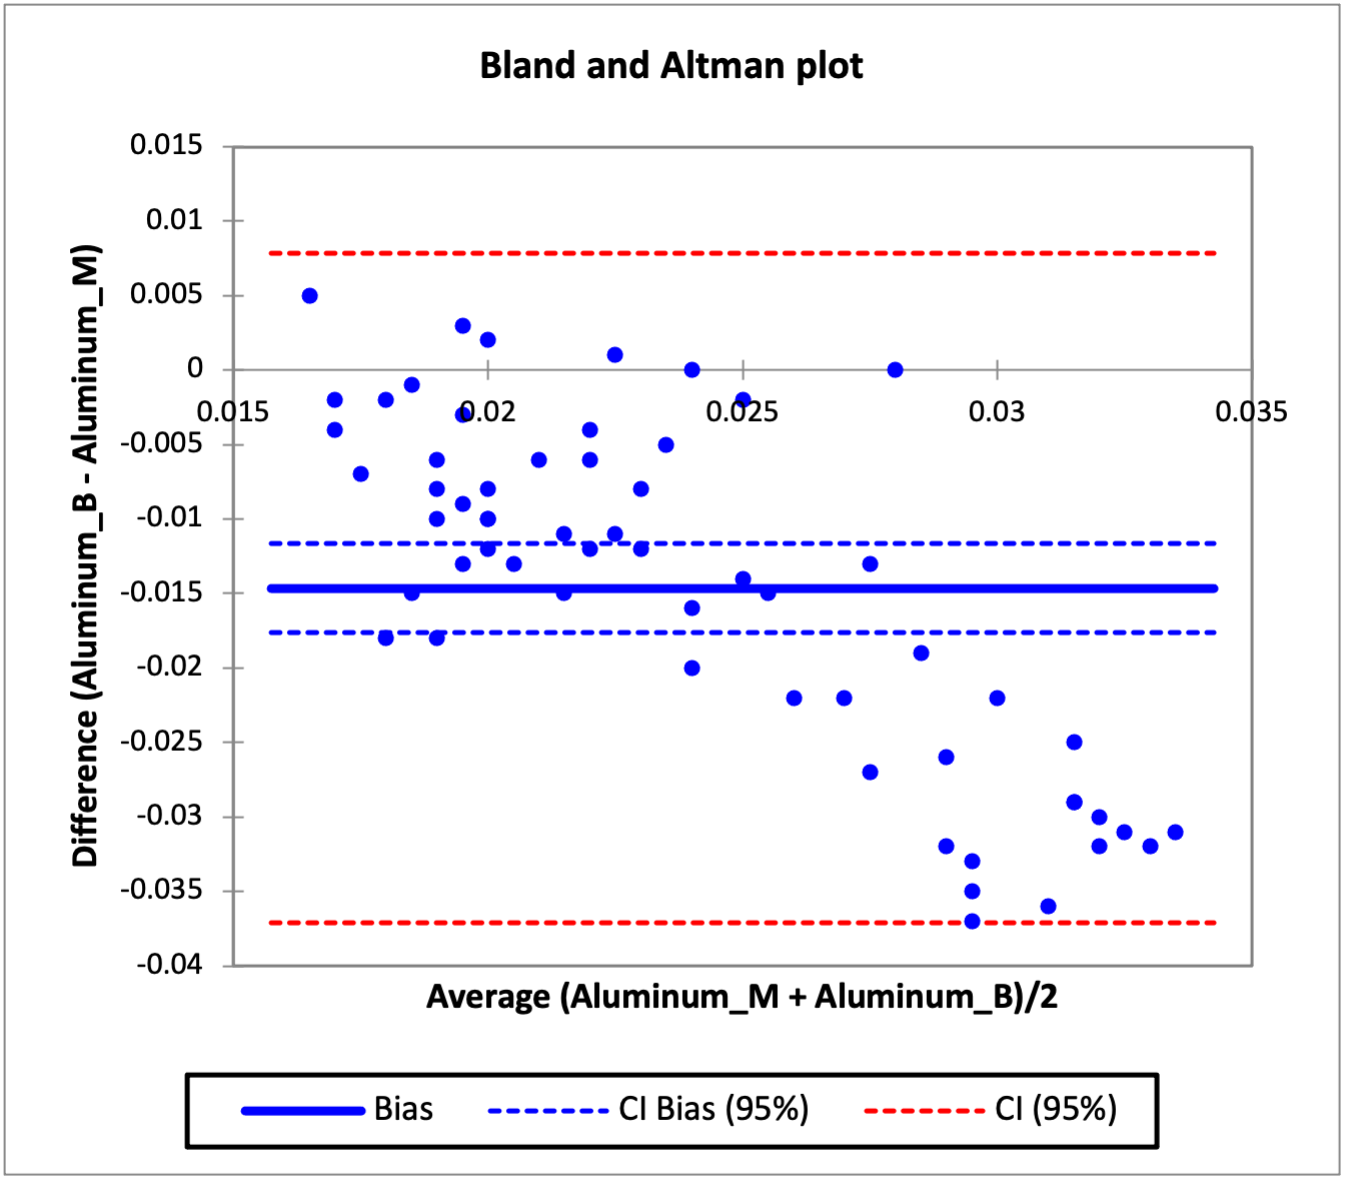
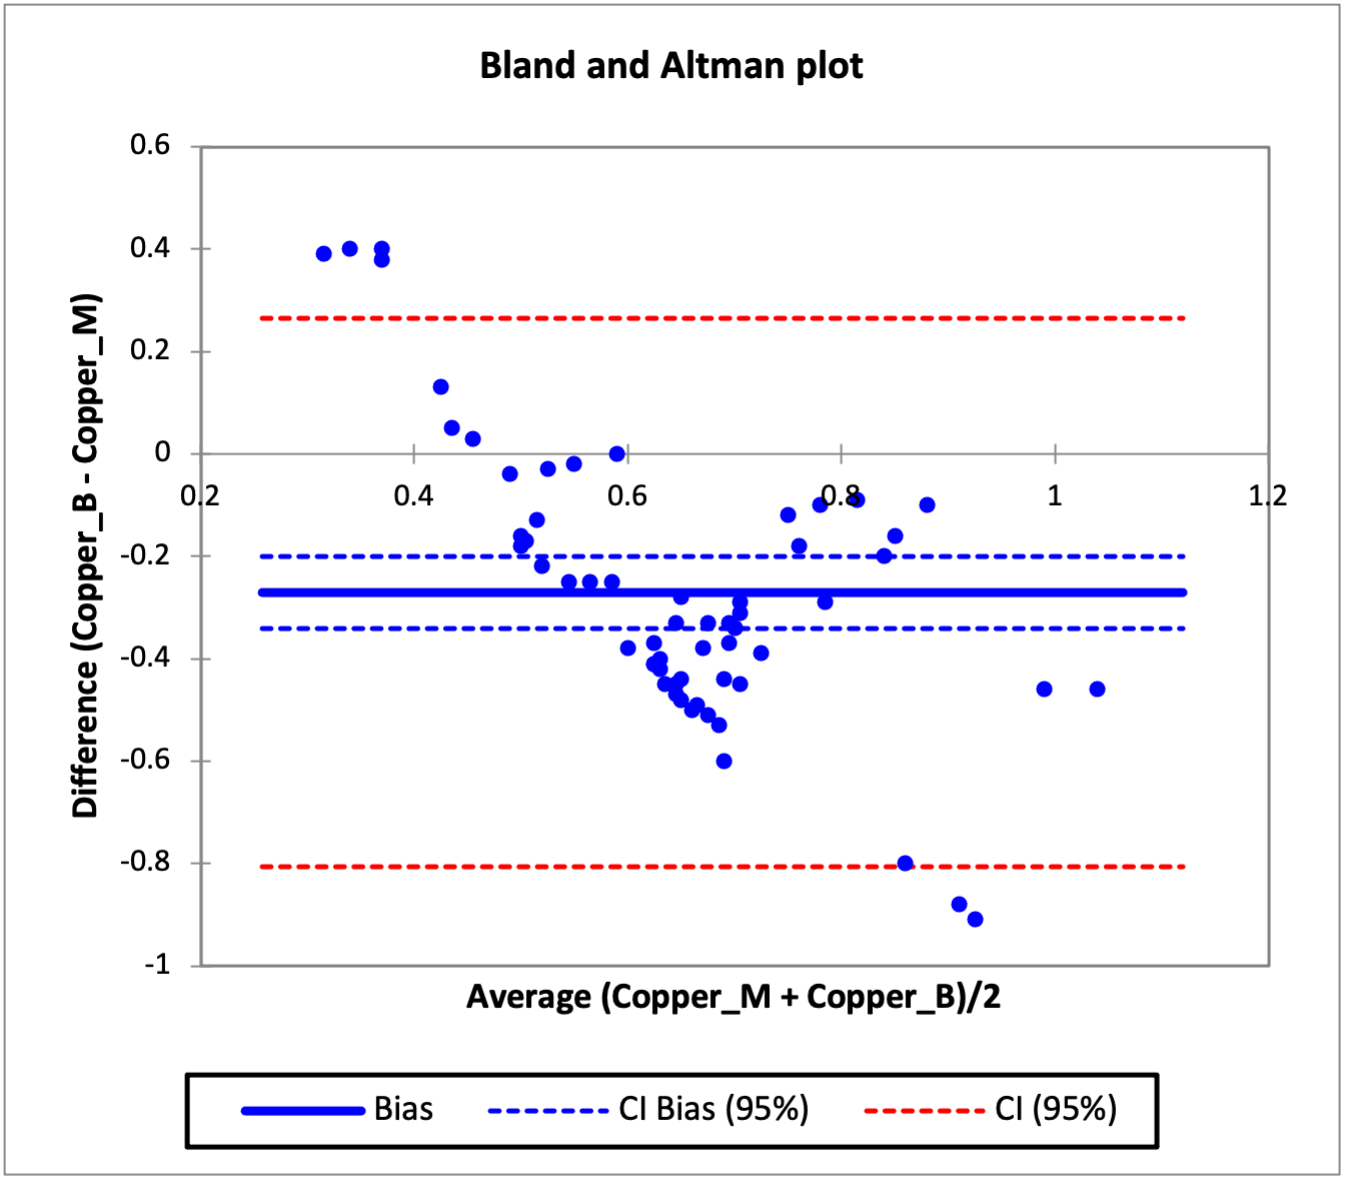
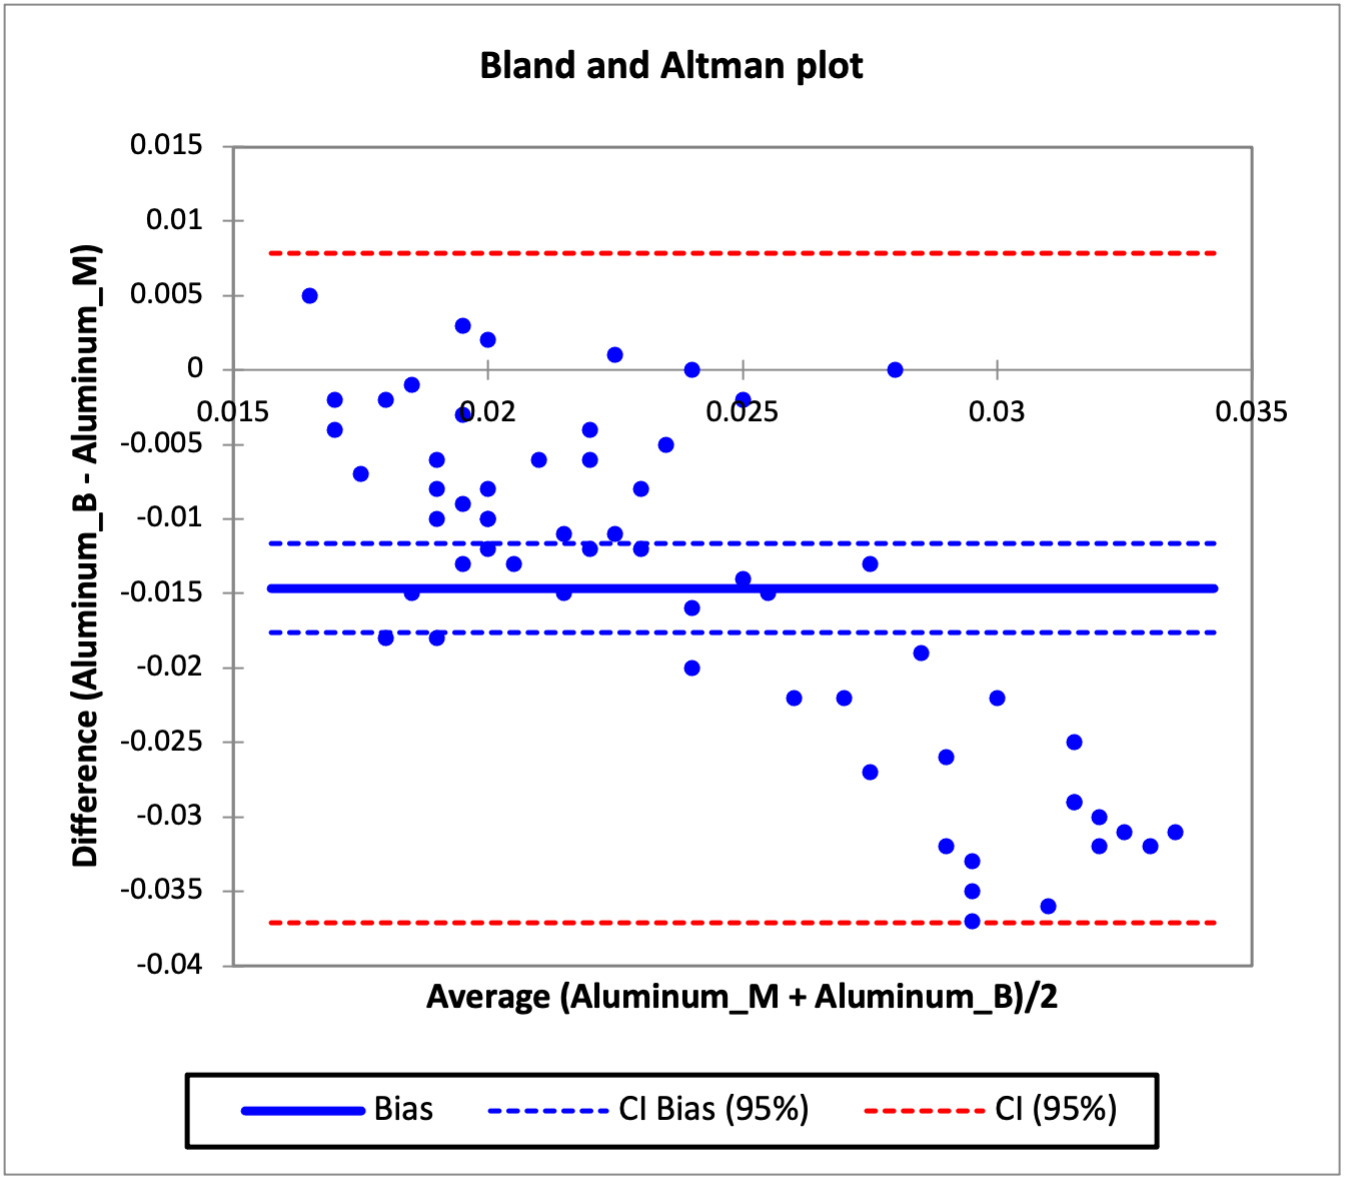
Bland and Altman Agreement test
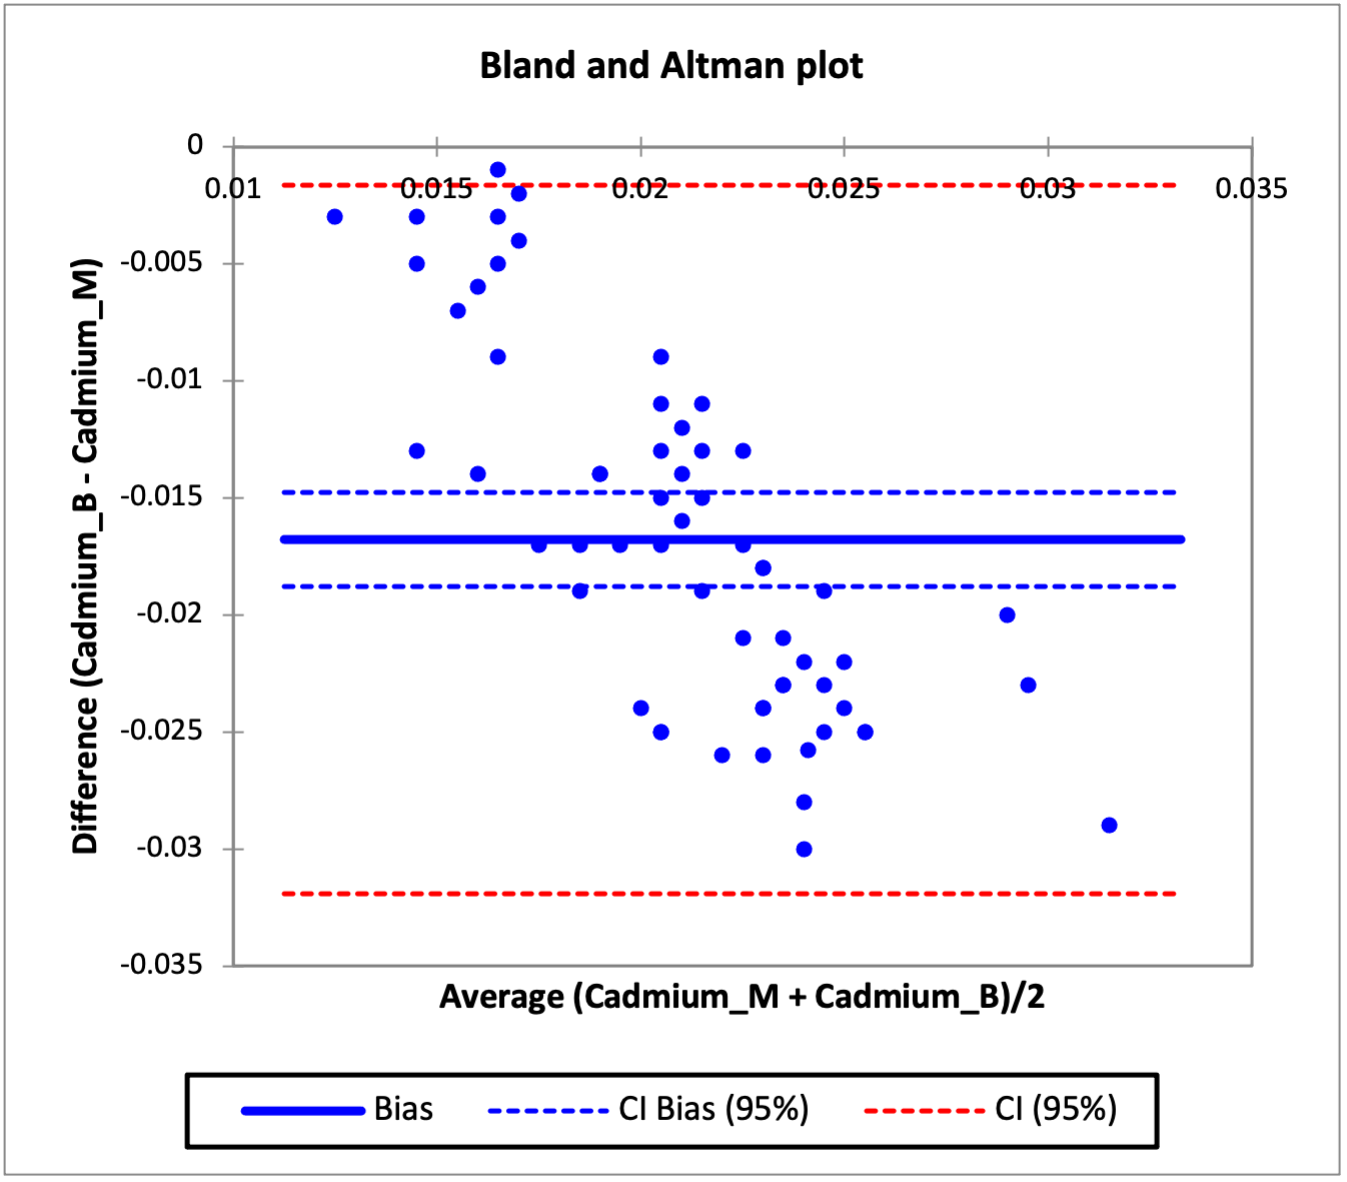
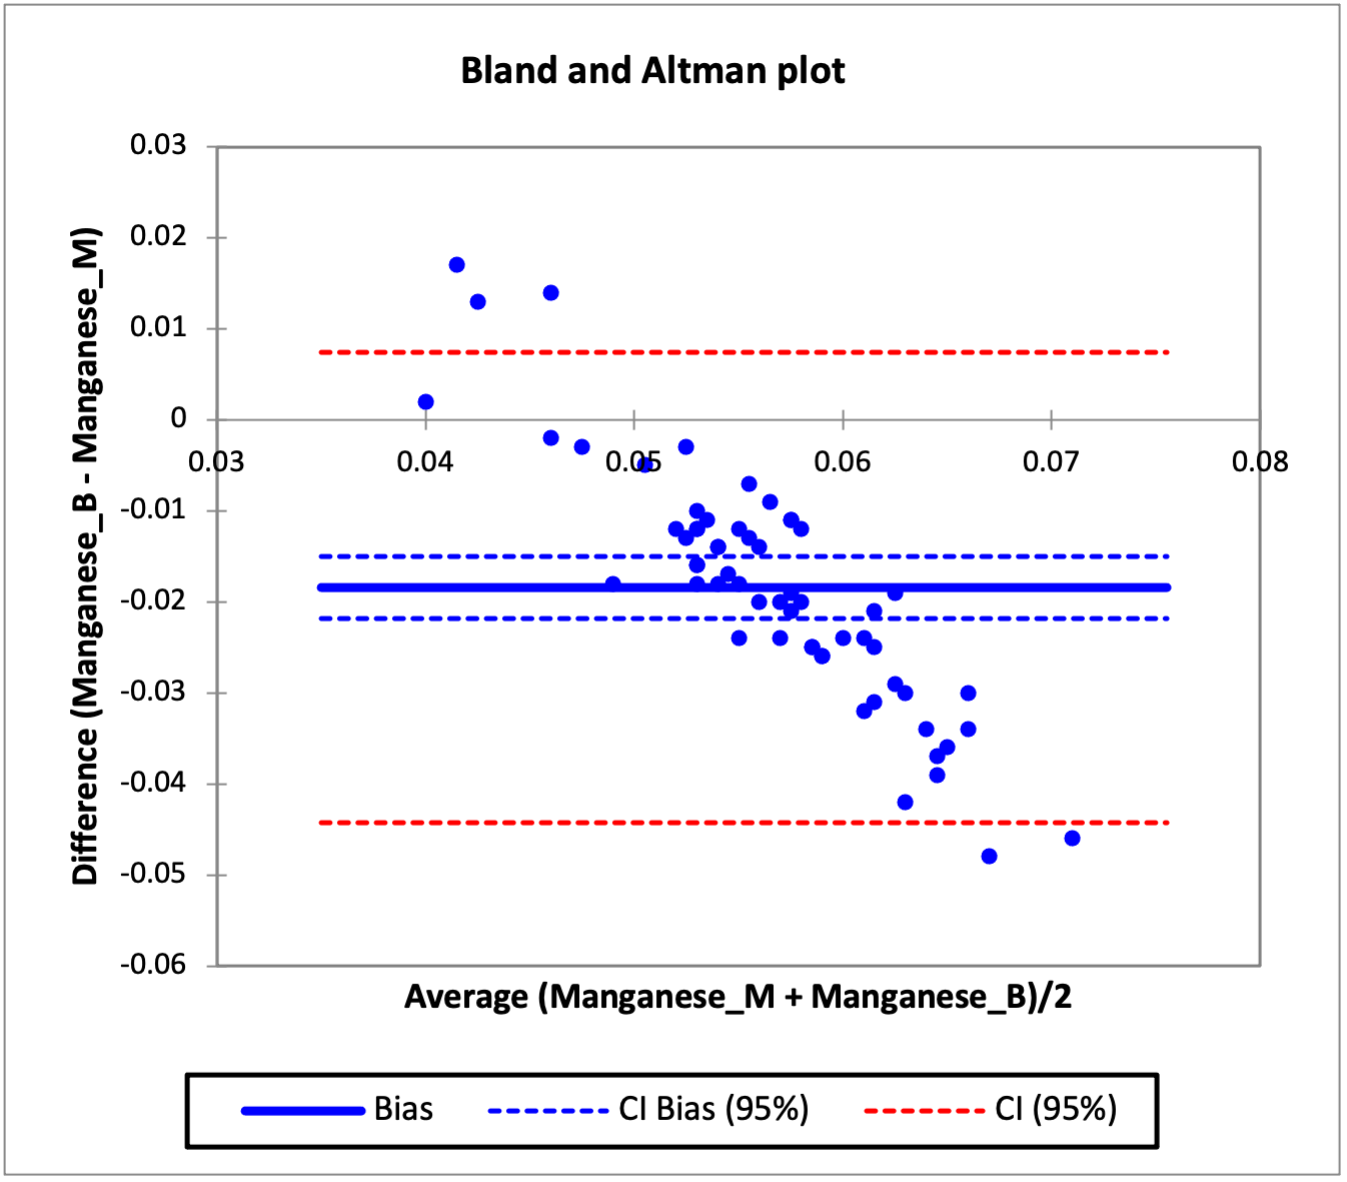
The agreement in the concentration of heavy metals in the mother and baby cord were evaluated using the Bland and Altman analysis test and the result are presented in Figures 4 to 8, while Table 3c shows the bias in the heavy metals concentration in the baby cord and limit of agreement. Figure 4 which shows the agreement between the concentration of cadmium in the baby cord and mother blood showed that there was systematic bias in the concentration of cadmium in the baby cord, as all the individual differences between the cadmium concentration in baby cord and mother blood were lower than the difference of zero. The bias obtained for the cadmium concentration in the baby cord was -0.0168 (thick blue line), which indicated that on average that the difference in the cadmium concentration in the baby cord was -0.0168 g/l less than what was obtained in the mother blood. The confidence interval for the bias ranged from -0.0188 to -0.0148 (thin broken blue lines), does not include 0 which confirms that the there is no agreement between the cadmium concentration in the baby cord and mother blood and confirm that the cadmium concentration in the baby cord has lower concentration than what was obtained in the mother blood. The limit of agreement for the cadmium concentration ranged from -0.0319 to -0.0016 (thin broken red line). Similar observations were also noticed in manganese, zinc, aluminum and copper metals in the baby cord. All had systematic bias for metal concentration in the baby cord, as the individual differences were all less than zero. The bias recorded for manganese, zinc, aluminum and copper in the baby cord were -0.0184, -0.2417, -0.0146 and -0.2703 respectively. The bias showed that the heavy metal concentrations in the baby cord were lower that what were obtained in the mother blood. The confidence interval of the bias for all the metals showed that they did not contain zero, which validated that the concentration of heavy metals in the baby cord did not agree with that of the mother blood.
Secondary deficiencies
In other to check the relationship between the metal level in the blood of the mother and the cord of the baby, Pearson correlation was used. The result is shown in the Table 4. While there was no strong linear relationship between similar metals concentration in the mother blood and the baby cord, good association was found between dissimilar metals in the mother blood and the cord blood. In particular:
-
the concentration of lead in the mother blood had good level of negative correlation with either Manganese and Zinc in the baby cord blood, which was significant at an alpha level of 0.05. The higher the concentration of lead in the mother blood the lower that concentration of Manganese and Zinc in the baby cord blood.
-
the concentration of aluminium in the mother blood had good level of positive correlation with copper in the cord of the baby and it was significant at alpha level 0.05. The higher the aluminium in the mother blood the higher the copper in the baby cord blood.

Toxic exposure and newborn body size
The relationship between the baby body size and the heavy metals in the mother blood is shown in Table 5. Aluminium in the mother had the strongest correlation with the baby weight and baby length. The higher the concentration of aluminium in the mother blood the smaller the weight of the baby and the length of the baby. This result showed that the level of Aluminium concentration in the mother blood should be monitored. There was no strong correlation relating the baby head circumference with heavy metals.
The selected variables in each component were used as independent variables while the baby weight, baby length and head circumference were used as dependent variables in developing regression models.
Principal Component Analysis
Principal component analysis was performed on the measured mother variables to obtain principal components used for independent variables in regression analysis. The principal axis method was used to extract the components, and this was followed by varimax (orthogonal) rotation to obtained uncorrelated components. The result of the Eigen-value, which was used to retain the number of components, is presented in Table 6. Eigen-one criteria and cumulative proportion of variances were used in selecting the number of components that would be retained for varimax (orthogonal) rotation. From Table 6, six components had Eigen-values greater than unity and the cumulative proportion of variance for the six components accounted for 72.44% of the total variance, which lead the choice in retaining six components for varimax rotations.
Eigen value
The numbers of maternal variables that were retained on each of the component after varimax rotation is presented in Table 5. The maternal variables are said to be loaded on a component if the factor loading score is greater than 0.4. From Table 5, maternal age, maternal weight, mother BMI, and gestation weight gain were the maternal variables that loaded strongly on component 1. For component 2, gestation age at delivery, gestation weight gain, and aluminium in mother blood loaded strongly on component 2. For component 3, maternal age, maternal height, adequate sleep and manganese in the mother blood loaded strongly on components. The maternal variables retained on each component were used as independent variables in developing regression equations that were related to some baby variables measured.


Factor loadings varimax rotation
The maternal variables loaded on a component with the factor loading score greater than 0.4 loading factor were used for the regression modelling. Due to large maternal variables available for modelling, only data that are bold and are within component D1, D2 and D3 were used.
Maternal variables and newborn body
Eight multiple linear regression models were developed relating the baby weight with various mother parameters, and the results are presented in Table 7.
Model 1 was developed relating the baby weight as the dependent variable, and the maternal age, mother body mass index (BMI) and gestation weight gained as the independent variables. The result showed that the predictive power of Model 1 was low due to the low coefficient of determination, R2 and the high Root mean square errors (RMSE). The R2 obtained for Model 1 was just 0.19, indicating that just 19% of the variation in the baby weight can be explained by the maternal age, mother BMI and gestation weight gained.
Model 2 related the baby weight with gestation age at delivery, gestation weight and aluminium. It was a better predictive model than Model 1, as the goodness of fit of Model 2 was far better than Model 1. The R2 obtained for Model 2 was 0.622, indicating that 62.2% of the variation in the baby weight can be explained by the independent variables used for Model 2.
Model 3 was developed relating the maternal height, maternal age and manganese but the result obtained showed that Model 3 performed the worst out of the eight models. The R2 of Model 3 was 0.0187 and the RMSE was 943.92. The result obtained from Model 3, showed that the maternal height, maternal age and manganese in the mother blood does not contribute significantly to the weight gained by the baby.
Model 4 performed better than the three previous models. The coefficient of determination of Model 4 was 0.686 and the RMSE was 533.78. Model 4, showed that 68.6% of the variable in the baby weight can be explained by gestation age at delivery, maternal weight and aluminium in the blood of the mother. The three factors contribute the most to the weight gained by the baby and can be used as predictor variables to predict the baby weight.
In other to optimize the accuracy of Model 4, a non-linear model (Model 5) including categorical variables was investigated. Power Model 5 was used to fit the baby weight and the independent variable used in Model 4 in other to see if the predictive power of the model can be increased. The result obtained showed that Model 5 (power model) did not increase the predictive power of Model 4; rather, the predictive power was decreased thus indicating that the relationship between the dependent variables and independent variables might possibly be linear in nature. The goodness of fit for Model 5 gave a R2 of 0.645 and a RMSE of 545.36. Result obtained from Model 4 highlighted some observations, which were outliers in the main data set. It was noted that observation 40 had a baby that was excessive overweight with a baby weight of 4200 g and observation 48 and 55 had babies that were excessive underweight with baby weight of 600 g respectively. Inclusion of these observations in Model 4 resulted to the increase in the error associated with the model.
Model 6 was developed using the same independents variables used in Model 4 but without the outliers. The result showed an improvement in the goodness of fit of the model than what was obtained in Model 4. The R2 value of Model 6 was 0.742, i.e. improved 8% with respect to what was obtained in Model 4.
Further models including categorical variables were therefore added as independent variables to those already identified in order to check whether the predictive power of the model for baby weight can be increased.
Model 7 included the quality of mother sleep during pregnancy. Result showed that there was improvement in the predictive power of the model. The R2 value for Model 7 was 0.728 with a RMSE of 501.69.
Model 8 was developed using Model 7 independents variables but excluding the outliers already identified. Model 8 gave the best predictive power for baby weight, with R2 of 0.76; this means that 76% of the variation in the baby weight can be explained with independent variables used in Model 8. This result indicates that sleeping pattern, gestation age at delivery, aluminium and maternal weight contribute to the baby weight gain.
Model 9 was developed incorporating an interaction term between the maternal weight and aluminium in the mother blood. Model 9 was the best due to it having the highest R2 and lowest RMSE. About 78% of the variation in the baby weight can be explained by variation in the maternal weight, gestation age, aluminium in mother blood and if the mothers had adequate sleep.
Five additional models were developed therefore, relating the baby length (instead of baby weight) with the various mother parameters as above.
Model 1 showed that obtaining accurate prediction of the baby length will not be possible as the goodness of fit of the model was poor. The coefficient of determination R2 was 0.109, indicating that just 11% of the variation in the baby length can be explained by the independent variables used in developing the model. The root mean square error (RMSE) for Model 1 was 6.724 and a mean square error (MSE) of 45.216.
Model 2 developed relating the baby length as the dependent variable with gestation age at delivery, gestation weight gained and aluminium gave a much better model than Model 1. The R2 value was 0.556, indicating that 56% of the variation in the baby weight can be explained by the independent variables used in Model 2.
Model 3 developed performed the worst with very low goodness of fit.
Model 4 related the baby length and gestation age at delivery, aluminium and maternal weight. The result showed significantly improvement compared to the previous three models. The coefficient of determination for Model 3 was 0.573 and the RMSE was 4.61.
It was observed from Pearson correlation (Table 5) that the baby weight is strongly correlated with baby length. The baby weight was used as an independent variable in addition with the other independent variables used in Model 4. The result showed significant improvement in the predictive power for the baby length. The coefficient of determination was 0.622 and the RMSE was 4.38. The result showed that the baby length could be predicted to a good degree with Model 5, and gestation age at delivery, aluminium, maternal weight and baby weight strong contribute to the baby length.
Model 6 relating the baby length and other independent variables was the best. The coefficient of determination obtained for model 6 was 0.668, which indicate that about 67% of the variation in the baby length can be explained by the gestation age, maternal weight, aluminium in mother blood and if the mother had adequate sleep.
Discussion
In this study, the higher metal (Aluminium, Cadmium, Copper, Lead, Manganese, Zinc) levels found in maternal blood than cord blood corroborate with earlier studies that reported how most neonatal metal exposures occur in response to maternal exposure and often occur during nutrient supply and exchange between the mother and the fetus.4,6,16 This also has far reaching implications on the need for public health practice and behavioural adjustments during pregnancy as often time occupational hazard exposures and consumption practices are the major route of maternal metal exposure during pregnancy.4,6,7,17
The observation that Zinc concentration is the most predominant in the maternal blood and cord blood is not surprising owing to the metabolic significance of zinc in development. Zinc metal has been implicated to function as an essential element and works in tandem with several other nutrient factors in growth maintenance and the modulation of the immune system and mental development.18–20 Also, maternal and cord blood copper being the second most predominant metal in this study is not also far from the metabolic significance of copper as an essential micronutrient because its deficiency has been implicated and linked to congenital birth disorders, induced maternal hypertension, premature birth and still birth, placental abruption and low birth weight.21–23 Findings in this study did not vary from reports that exist in literature. Maternal blood Aluminium concentration had the highest significant negative correlation with baby body weight (-0.6081) and birth length (-0.6107). On the overall, Aluminium, Cadmium, Copper, and Zinc contributed significantly to low-birth-weight outcomes in offspring outcomes. The implication of these observations is that although metals such as Cadmium, Copper and Zinc may not have had direct influence on the baby length and baby weight individually, an interaction between their impacts on other morphometric factors such as head circumference, birth length and birth weight must have influenced the general weight outcomes. This finding is in tandem with the study of Emokpae et al24 which reported that maternal Cadmium levels significantly correlated negatively with baby weight and low birth weight outcomes in Benin city South western Nigeria and with the study of Johnson et al. (2014) in North Carolina. The observed negative correlation for zinc however does not agree with Emokpae et al.24 as maternal blood Zinc concentrations positively correlated with baby weight outcomes implying that it contributed to weight gains. Another significant explanation of the ability of cadmium to negatively influence low birth weight outcomes is related to the mechanism behind its transportation as it has the ability to be easily bound and transported by the metallothionein thereby increasingly displacing the Zinc cofactor in heam. Once this is done, Zinc transportation which is an essential element for metabolic stability is distorted which in turn affects the functional role of zinc as a growth factor.25,26 On the other hand, the reported significant negative correlation of copper to low-birth-weight outcomes is similar to the reasons given for zinc as it has been reported that copper also acts as a cofactor to several antioxidants which fights against oxidative radicals capable of inducing inflammatory responses that might affect weight negatively.27–29 Indeed, altered homeostasis of essential elements can impact on newborn body size.4
In another development, the non-significant correlation of manganese to outcomes of baby size may be explained and linked to the essentiality of manganese which may imply that the metal levels in the mother and the baby is at a level where it is readily absorbed for proper body functioning. On the other hand, the negative correlation between Lead and baby length may implicate lead in affecting baby growth as previously postulated but however may be acting not as a front liner in affecting baby size. As earlier stated, aluminium is said to have the highest contribution of impeding baby size with an R2 value of 0.369 and 0.376 in the linear and quadratic models of prediction of factors affected. Although Aluminium toxicity has been established to induce several levels of neurodegeneration, pregnant women have linked its route of exposure in prenatal conditions to drug administrations in form of injections and continual consumption of antacids. Likewise, pregnant women continually consuming citrate containing beverages are said to significantly increase their ability to absorb aluminium from the gut which is eventually passed on to their babies.11,17 The high R2 value implicative of the fact that aluminium contributed to about 37% and also agrees on the ability of aluminium to significantly impact birth weight outcomes negatively.11 Another dimension to the observation concerning aluminium is the dependability of Aluminium status on the concentrations of essential elements like Copper, Manganese, Selenium, Zinc, that are essential for several enzymatic functionalities.26,30,31 Putting all size factors (birth weight, baby length, and low birth weight and head circumference) into consideration, however, there were also significant positive correlation between birth weight and BMI. The implication of this observation is that the BMI (a function of maternal weight and height) positively affects the baby weight. This trend is in consonance with conclusions established in various researches in literature that low BMI mothers tend to have premature babies while high BMI mothers are prone to giving birth to over weight babies; an indication that this factor should be closely monitored throughout pregnancy.32,33 Also, the positive correlation between maternal BMI and baby body weight is in agreement with findings at the antenatal attendees at Usman Danfodio University Teaching Hospital UDUTH,Sokoto, Nigeria.18 Several factors have been alluded to influence underweight birth outcomes which includes parity, maternal health status, short birth spacing, nutritional factors, socioeconomic factors, quality and quantity of antenatal care as well as maternal age.34 All of these factors are modifiable hence it is of paramount importance to increase awareness campaigns on safe pregnancy, nutrition and quality care during pregnancy.
Following the principal component analysis, the regression model for the factors that best predicts the baby weight and baby length were carried out. Outcomes from the analysis revealed that the best model that predicted the baby weight was the model 8 having a predictive power for baby weight with R2 of 0.76 implying 76% of the variation in the baby weight can be explained by the sleeping pattern, gestation age at delivery, aluminium and maternal weight. This finding further gives credence to our earlier submissions on the role of maternal blood Aluminium concentrations on baby weight. Likewise, the reported positive coefficients in the model for maternal weight give credence to our earlier submission on maternal BMI since it remains a function of the maternal weight and height.35
Relative to the model for the prediction of baby length, model 5 revealed that the coefficient of determination was 0.622 and the RMSE was 4.38. The result from development of the models showed that the baby length can be predicted to a good degree with model 5, and gestation age at delivery, aluminium, maternal weight and baby weight strongly contributes to the baby length. The factors listed above could be observed to have been included in the predictability of the body weight except for baby weight which was included in the model.
The limited population size is obvious limitation of this study. Furthermore, this is cross sectional study; causal relationships cannot be confirmed in the pathophysiological mechanism to link the blood metal with anthropometry, secondly study was based in one ethnic group and may not be generalised to other ethnicities and finally only blood metal especially lead levels which reflect only recent exposure.
Conclusions
Many of the determinants of birth weight are related to maternal suboptimal nutrition and infants’ deficiency of some essential trace elements, and also to maternal environmental exposures to toxic pollutants. Elaboration of policies aimed at promoting safer foods and environment, healthy dietary habits and lifestyles as well as reducing the health impact of chronic diseases needs to pay special attention to the pre- and periconceptional period. Further elucidation of the links between environmental exposures and birth outcomes must come through linking biomarkers and surveillance approaches, including monitoring improvements in preconception health.
Acknowledgments
This study was partly funded under the project “Lifestyle and environment and transgenerational health in Nigeria” granted by the University of Tuscia, Viterbo, Italy, to the pan African NGO NOODLES (Nutrition & food safety and wholesomeness – Prevention, education and research, www.noodlesonlus.org) (2017-2019).
Funding
None
Authorship contributions
All co-authors contributed to study design and writing of manuscript.
Competing interests
The authors completed the Unified Competing Interest form at http://www.icmje.org/disclosure-of-interest/ (available upon request from the corresponding author) and declare no conflicts of interest.
Correspondence to:
Orish Ebere Orisakwe, World Bank Africa Centre of Excellence in Public Health and Toxicological Research (PUTOR), University of Port Harcourt, PMB, 5323 Port Harcourt, Rivers State, Nigeria.