
Globally, over 38 million children (<5 years) and 340 million children and adolescents ( 5-19 years) were overweight and obese in 2019.1 The prevalence of overweight and obesity has increased by approximately five folds in the past 40 years.1 The rise in obesity will undermine the achievement of Sustainable Development Goal (SDG)-32 “ensuring healthy lives and promoting well-being for all ages” as obesity has been linked to Non-Communicable Diseases (NCDs).1
The low-and middle-income countries (LMICs) formerly confronted with a high prevalence of undernutrition (stunting or thinness) are now facing over-nutrition (overweight or obesity) as an additional burden.3 By comparing National Family Health Surveys, it has become evident that overweight or obesity has increased among adolescents (15-19 years) in India. The prevalence of overweight or obesity among adolescent boys (15-19 years) was 1.7% in 2005-06,4 which increased to 4.8% in 2015-16.5 Similarly, among adolescent girls (15-19 years), it was 2.4%4 and became 4.2% in 2015-16.5 The Comprehensive National Nutrition Survey (2019) reveals that approximately 4% (4.6 million) of children (5-9 years) and 5% (12 million adolescents) of adolescents (10-19 years) were overweight or obese in India.6
Various factors contribute to the development of overweight and obesity among children and adolescents. In addition to a genetic predisposition, the food environment greatly influences food choices, eating behavior, and nutritional status of children and adolescents.7–9 The marketing, including advertising of food and beverage high in fat, sugar, and salt (HFSS) is recognized as one of the influential environmental factors impacting an individual’s behavior, leading to a rise in overweight, obesity and other diet-related NCDs.10 Marketing through television is one of the critical factors influencing food choices, eating preferences and eventually contributing to overweight and obesity among children and adolescents.8–10 This may be attributed to the inability of children and adolescents to comprehend the commercial context. Thus, are easily persuaded7,11 to buy the product advertised on television.
Existing research using brief content analysis of food advertisements on Indian television has examined the prevalence of misleading advertisements.11–13 There is a paucity of research evidence on comprehensive content analysis of food advertisements broadcasted on television and how the advertisements differs by channel. The present study was conducted to fill the gap in literature, by undertaking detailed content analysis of Food advertisements broadcasted on the most popular national-level television channels among children and youth. The differences in the content of these advertisements: a) between channels (children vs youth); b) within the channel by day type (weekend and weekdays) and time were also explored.
METHODS
Study design and sampling
A cross-sectional study was conducted during September-October in 2020. The topmost popular national television channels among children (2-14 years) and youth (>14 years ) were selected based on the rating data obtained from the Broadcast Audience Research Council India (BARC), a television audience measurement service.14 In total, six channels, both free-to-air (E24) and paid channels (Nick, Sonic Nickelodeon, Pogo, Zing, and MTV), were included in the present study. Children’s channels included in the present study were: Nick, Sonic Nickelodeon, and Pogo, whereas youth channels were, E24, Zing, and MTV. The study only analyzed secondary data and does not involve any human subjects, therefore, an informed consent procedure was not required.
Data collection
The data was collected by recording programs on the six selected channels for three consecutive weeks in September 2020. In three weeks, weekdays were randomly selected by a lottery method and all weekends were considered for both children’s and youth channels. In alignment with other Indian13 and international research,15 hours selected for recording in our study for all selected channels were: 4:00pm to 10:00pm on both weekdays and weekends with additional hours (10:00am-2:00pm) on weekends to understand the variability in advertisements broadcasted on these television channels.
Instrument and measures
The coding sheet was developed by adapting existing validated tools16,17 and previous brief content analysis research conducted in India13 and other countries.7,13,18 All recorded advertisements on selected channels were independently coded by two authors (HM and SD) to ensure consistency and avoid discrepancies while coding the advertisements. Any coding disagreement between the two researchers was resolved through a discussion with other senior authors (SB and DB) involved in this research. A pilot exercise was also performed by coding recorded advertisements (n=75) to ensure consistency in entering the data by HM and SD.
As per coding guidelines, the advertised Foods on these channels were classified into four main categories: only food advertisements, only beverage advertisements, food + beverage advertisements, and food and beverage related advertisements. The pre-packaged food and beverage shown in the advertisement were further categorized as healthy or HFSS, using World Health Organization’s (WHO) South East Asian Region (SEAR) Nutrient Profile Model, based on thresholds for fat, salt, and sugar.19 Additionally, Codex guidelines for the use of Nutrition and Health claims (CAC/GL 23-1997) were used, providing details of nutrient health claims and the defined value for each claim.20 These guidelines helped determine whether the claims shown in advertisements were consistent with the information on the label. The labels of food products were procured and checked by two authors (HM and SD) independently for each nutrient to identify any misleading claims. SB and DB further verified these claims by randomly checking the advertisements (n=5% of Food advertisements).
Data analysis
We assessed the frequency of advertisements, type of advertisements, categorization of advertisements, brand benefits, selling point claims, and endorsement strategies used. All data were analyzed to understand the content of Food advertisements and differences between channels (children and youth channels) and within these channels by day and time. The data were analyzed using Stata version 13.0 (StataCorp, College Station, Texas, USA).21 For categorical data, Pearson test, and Fisher’s exact test and for continuous data independent t-test was used. p-value less than or equal to 0.05 was considered statistically significant.
RESULTS
The total duration of programs observed was 168 hours, over six weekdays and six weekends on three children’s and three youth channels. During these hours, a total of 5569 advertisements (Food advertisement:1735; Non-food advertisement:3834) were seen. A higher proportion of advertisements were seen on the children’s channel (54.4%) than on the youth channel (45.6%) (Table 1).
Type and frequency of advertisements
Advertisements seen on these channels (children’s and youth) were broadly categorized under two categories i.e. Food advertisements and Non-food advertisements. The Food advertisements were further categorized into food only (candy, chips, chocolates, etc.); beverage only (juices, fizzy sweetened drinks, etc.); food + beverage (pizza and a fizzy sweetened beverage together); and food and beverage related advertisements (food and grocery delivery services, food outlets etc.).
The total advertisements broadcasted on children’s and youth channels were 3026 and 2543, respectively. The Food advertisements aired were significantly higher on children’s channels than youth channels (38% vs 23%, p<0.001). By day type, no statistically significant difference was seen for Food advertisements shown on children (weekday: 37.4% vs weekend: 38.5%, p=0.553) and youth channels (weekday: 23.6% vs weekend: 22.5%, p=0.513) (Table 1).
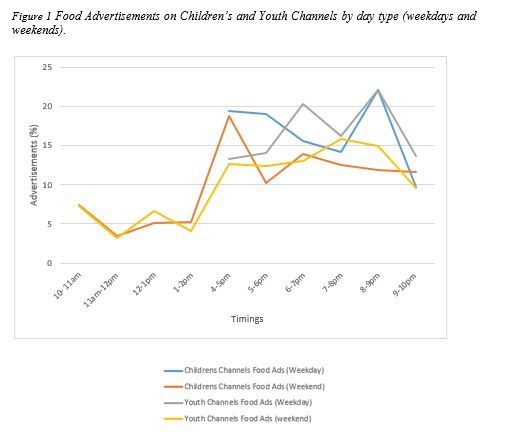
More than one–fifth of Food advertisements were advertised between 8pm–9pm on weekdays on both children and youth channels (22.1%). On weekends, the maximum Food advertisements were broadcasted in the evening between 4 pm-5 pm on children’s channels (18.8%), and 7pm-8pm (15.9%) on youth channels (Figure 1).
.jpg)
Classification of food advertisements
With further classification of Food advertisements to: 1) only food; 2) only beverage; 3) food + beverage and; 4) food and beverage related advertisements, analysis showed that on children’s channels, food (P<0.001) and food and beverage related advertisements (P<0.001) were seen more compared to youth channels. In contrast, beverages advertisements were seen more on youth channels (P<0.001). Within the children’s and youth channel, no significant difference was seen for any of these categories by weekend or weekday (Table 2).
Of the food advertisements on the children’s channel, almost one-third of advertisements were of candy (32.5%). More than half of the advertisements (69.7%) in beverage category were of food supplements on children’s channels. In contrast, very few food and beverage related advertisements were seen on both channels and it was mainly the pizza outlet advertisements that was seen. Within the children’s channels few foods were shown significantly more on weekdays (noodles, p=0.010) others on weekends (biscuits, P=0.013) (Table 3).
Similarly, on the youth channel, the most common advertisement was for candy (32.9%) within food advertisements. Of the beverage advertisements, one-third of the advertisements were for food supplements (38.4%). Similar to children’s channels, it was seen that few food and beverage advertisements were shown more on weekdays (noodles, p=0.003; food supplements, P=0.002) other on weekends (tea/coffee, P=0.012; fizzy sweetened beverages, P<0.001) (Table 3).
Categorization of Food advertisements as healthy and HFSS
Food advertisements were categorized as healthy and HFSS using the WHO’s SEAR Nutrient Profile Model based on sodium, fat, and sugar threshold values.19 Most advertisements broadcasted on the selected channels were HFSS (88.6%), and a few were healthy (11.4%). More HFSS advertisements were on children’s channel (95.9%) compared to 76.1% on youth channel (P<0.001). Among children’s channels, it was evident that HFSS foods were advertised more on weekends compared to weekdays (P=0.006), but on the youth channels this difference was not significant (p=0.089) (Table 4).
Within HFSS foods, foods high in sugar were seen more on children’s (55.2%) than youth channels (41.5%) (P<0.001). By day type, high sugar foods were advertised on youth channels on the weekends (P=0.006) and high in fat and sodium on weekdays (P=0.045). Whereas on children’s channels, difference was only seen for HFSS as were advertised more on the weekend (P<0.001) (Table 4).
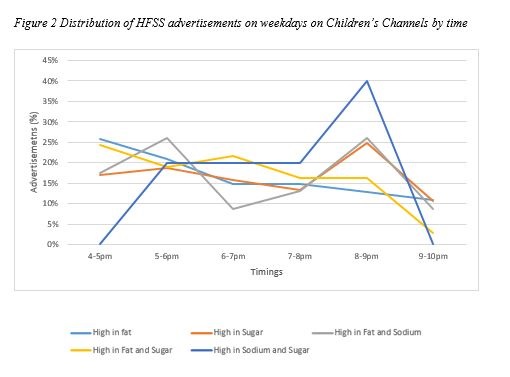
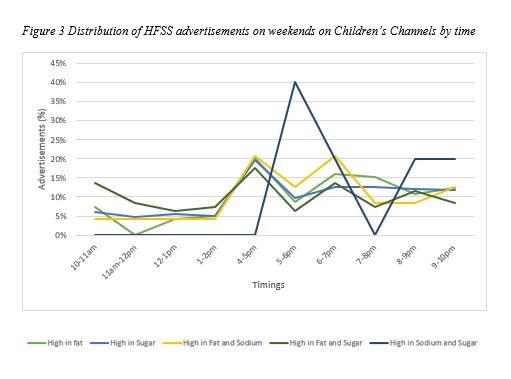
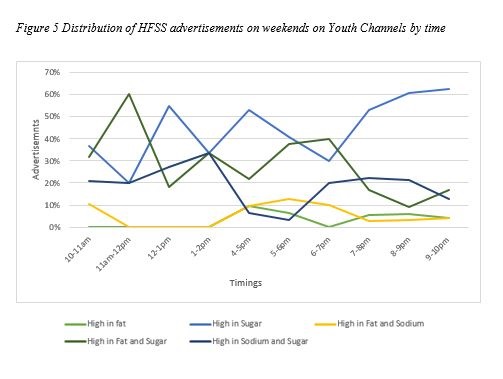
Since the majority of advertisements were HFSS, we attempted to understand the variation of these advertisements broadcasted by timings. On children’s channels, maximum proportion of advertisements for foods high in sugar and sodium peaked between 8 pm-9pm on weekdays (Figure 2) and 5pm-6pm on weekends (Figure 3). Whereas, on the youth channels, the peak was observed for foods high in fat and sugar between 6pm and 7pm on weekdays (Figure 4), and foods high in sugar between 9pm and 10pm on weekends (Figure 5).


Brand benefits of advertisements
Companies claimed various benefits to attract users, and these benefits were found to be different for children and youth. The most common brand benefit on children’s channels were sensory-based characteristics (40.9%) i.e. taste, texture, aroma, etc. followed by suggestive users for children or family (25.8%). While on youth channels, the most prevalent brand benefit claimed was use of emotive claims (31.6%) i.e., feelings of fun, popularity, etc. followed by sensory characteristics (23.1%) and price (22.8%).
Selling point claim
Companies were using different selling claims; approximately one-fourth of Food advertisements on youth channels (23.7%) and 13.3% on children’s channels had no selling claims (P<0.001). The taste of an advertised product (28.3%) was claimed as one of the selling points, significantly more on children’s channel than youth channel (P<0.001). Whereas, on youth channels, general health claims (22.9%) were most common and were significantly higher compared to children’s channels (P<0.001) (Table 5).
Concerning the nutrient content, which is also a selling point claims (Table 5), enhanced nutrients (increase in content is at least 30% compared to a similar product) was the highest-selling claim seen on children’s channels (39.2%), followed by protein enriched (36.0%). Similarly, the source of vitamins and minerals was claimed most frequently (77.8%), followed by rich dietary fiber (16.7%) on the youth channels. None of these claims were found to be misleading when verified through the food labels.
Endorsement strategies
On the children’s channels, the most common endorsement strategy used was the presence of children in almost half of the advertisements (49.0%), and on youth channels, endorsement by a non-sports celebrity (32.6%).
DISCUSSION
This is one of the first studies that have undertaken the detailed content analysis of food advertisements (i.e. only food, only beverage, food + beverage, and food and beverage related) broadcasted on most popular channels among children (2-14 years) and youth (>14 years) on weekdays and weekends.
The study findings showed that 38% and 23% of advertisements were of food on children’s and youth channels, respectively. Similar to our findings, a study conducted in India reported that 46% of advertisements were for food on television programs targeting children,22 whereas a study conducted in Argentina showed a lower (20%) proportion of food and beverage advertisements.23
Our study findings showed no difference in weekends and weekdays for food and non-food advertisements. This could be attributed as the study data was collected when schools were closed due to COVID-19 and children were confined to their homes for both academic and leisure activities.24 Thus, companies might have considered the weekday and weekend as an equal opportunistic time to advertise their products to attract the young population. Similarly, in UK, the Advertising Standards Authority reported an increase in exposure to advertisements (soft drinks, sports drinks, confectioneries and snacks) among both children and adults during the COVID-19 lockdown, as compared to 2019.25
In our study, the Food advertisements were broadcasted on both the children’s and youth channels during 8pm–9pm on weekdays. On weekends, the maximum number of Food advertisements were seen between 4pm-5pm on the children’s channels and during 7pm- 8pm on the youth channels. Secondary data from BARC also supports our findings and shows that on both weekdays and weekends, the peak viewership on youth channels is between 8:30pm-9:00pm.26
In our study, a total of 88.6% of advertisements were for HFSS foods. These HFSS advertisements can create and promote an obesogenic environment that can strongly influence children’s buying behavior.27 Similar findings from studies conducted in India12,28 and Southeast Asian countries29 highlighted that majority (90-95%) of advertisements broadcasted on television channels targeting children and youth were of HFSS foods. The most frequently advertised products on children’s (32.5%) and youth (32.9%) channels in our study were candies. These findings are similar to other studies conducted in India22,28 and other countries like Lebanon,30 Sri Lanka,29 and the United States.18
Using children in advertising or any other communication type for brand building is likely to affect purchase intentions.31 In our study, the most common endorsement strategy was children’s presence in almost half of the advertisements (49%) on children’s channels. Similar findings were reported from a study conducted in Sri Lanka.29 Another study depicting global representation reported that out of 16 countries, 30% of food and beverage advertisements contained promotional characters like company‐owned media characters, brand‐equity mascots, third‐party licensed characters, entertainment, or sports celebrities.32 Contrary to this, our study showed the presence of cartoons in only 7.7% of advertisements on children’s channels. The use of cartoon characters, fantasy world, and excitement in advertisements is strongly correlated with purchase of those products among children.33 In light of mounting evidence, few countries have taken initiatives by formulating policy or pledges by the industry to restrict the use of brand mascots, to promote HFSS foods.34 The Chilean government introduced a food labeling law in 2016 with a measure for the removal of licensed and brand characters to promote HFSS foods.34
Marketing gimmicks like offers, health benefits, and price reduction have positively impacted a brand.13 In our study, sensory-based characteristics such as taste, texture, and aroma were the most used brand benefits claimed (40.9%) by the advertisements on children’s channels. A review conducted in 2008 also highlighted hedonistic characteristics like taste and sensory appeal are used to promote children’s food products.35 This is because taste and smell provoke the advertised food consumption pattern rather than similar products that are not heavily advertised, thus making a good appeal to target children.36 A study conducted in the United States stated that adolescents could be persuaded by the emotive messages of advertising, which play into their developmental concerns related to appearance, self-identity, belongingness, and sexuality.37 Our study similarly found emotive claims (31.6%) to be a prominent marketing gimmick on the youth channels. This shows that companies invest in research to develop their strategy to cash in on the development and emotional needs of the customer.
In India the Consumer Protection Act, 2019 stipulates punishment for false or misleading advertisements by any manufacturer.38 Additionally, the program and advertising codes prescribed under the Cable Television Network Rules, 199439 state that ‘No advertisement which endangers the safety of children or creates in them any interest in unhealthy practices or shows them begging or in an undignified or indecent manner shall not be carried in the cable service.’ The Food Safety and Standards Act, 2006 has clause 53 in section 56 that clearly states that any person who publishes or is a party to the publication of an advertisement which, a) falsely describes any food or; b) is likely to mislead as to the nature or substance or quality of any food or gives a false guarantee, shall be liable to a penalty which may extend to ten lakh rupees.17 However, no clear reference to the marketing of HFSS foods to children or exact time regulations were made in these acts. A self-regulatory voluntary organization, the Advertising Standards Council of India (ASCI) can also pressurize advertisers and companies to withdraw objectionable advertisements.40 Despite these initiatives in India, there are advertisements of HFSS foods shown on television, that appeal to children. Hence, similar to other countries,41 there is a need for regulatory guidelines for creating a better food advertising environment by monitoring and controlling television food advertisements. There is need to develop national databases for tracking all broadcasts to periodically inform the enforcement of food advertisements targeting children and youth in India.
This study is one of the first of its kind in India, which comprehensively analyzed the content of food advertisements between and within channels in the Indian context. Therefore, it can act as a foundation for conducting more region-specific studies to assess the impact of the obesogenic environment among children and youth. One of the limitations of our study is that the study only analyzed the content on national children’s and youth channels, thus the findings of this study may not be generalizable. We also did not conceptualize any confounding variables for the current research question, and therefore a regression model was not applied. Additionally, other modes of exposure to advertisements including advertising on streaming services, internet, social media, etc. were not explored.
Disclosure
The statements in this publication are the views of the authors and do not necessarily reflect the policies or the views of United Nations Children’s Fund (UNICEF). The designations employed in this publication and the presentation of the material do not imply on the part of UNICEF the expression of any opinion whatsoever concerning the legal status of any country or area, or of its authorities or the delimitations of its frontiers.
Funding
None
Authorship contributions
MA, SB, and VS conceptualized the study. SB, DB, HM & SD contributed to study administration. SB and DB supervised data collection and management. DB, HM, and SB contributed to data analysis and interpretation of results. SB, DB, HM, and SD drafted the manuscript. MA and VS reviewed the manuscript critically for intellectual content. All authors reviewed the manuscript and approve its contents.
Competing interests
The authors completed the Unified Competing Interest form at www.icmje.org/coi_disclosure.pdf (available upon request from the corresponding author), and declare no conflicts of interest.
Correspondence to:
Ms. Shalini Bassi, MSc
Health Promotion Division
Public Health Foundation of India
Plot No. 47, Sector 44
Gurgaon, Haryana, 122002, India.
[email protected]