Neglected tropical diseases (NTDs) are endemic in Cameroon, especially lymphatic filariasis, onchocerciasis, schistosomiasis, soil-transmitted helminthiasis, and trachoma. Strategies to tackle these diseases are mainly based on the preventive chemotherapy (PCT), during periodic mass drug administration (MDA) campaigns and intensified disease management campaigns. The monitoring and evaluation system is defined accordingly to maintain a data-driven program.
Since 2014, the ministry of public health (MoPH) in Cameroon has been setting up an integrated health management information system (HMIS) based on District Health Information Software (DHIS2). This system, also recommended by The World Health Organization (WHO), can function as a data warehouse to facilitate collection of good-quality data and support analyses of trends.1 However, in Cameroon, the national HMIS did not appropriately report NTDs program data. For example, the system was used to collect the information of the cases and deaths for NTDs from monthly health facility reports, whereas the NTD program reporting is mainly based on annual mass drug distribution campaigns, surgery campaigns or surveys. In fact, NTD campaigns generate data like prevalence, number of people enumerated and treated, number of cases with lymphatic filariasis or trachoma complication identified, number of suspect cases of leprosy identified, number of trichiasis surgery performed, etc. Also, current alternative strategies in support to the onchocerciasis control program promote testing people for onchocerciasis or loiasis first before treatment.2 Thus, the number of people tested should be taken into account into the database.
The first of four rules proposed by Coiera3 for the reinvention of health care states that technical systems have social consequences. Therefore, designing a health information management system for NTDs should consider organizational and human factors that might affect NTD program data integration process into DHIS2. For instance, it will be useful to identify factors that would influence acceptability and use of DHIS2 as a HMIS platform by NTD program stakeholders.
Many models and theories have been designed for information and communication technologies (ICT) adoption. These include the technology acceptance model (TAM), and the unified theory of acceptance and use of technology (UTAUT).4,5 TAM and UTAUT have been developed to better understand why users accept or reject a technology, and to predict the degree of acceptance of a new technology. The UTAUT is the most extensively theory used in ICT adoption studies. It has been applied in a variety of study settings including healthcare,6 and used in different countries including developing countries7,8 with some of them reporting acceptance of DHIS2,9–11 including Cameroon.12
This study reports results of a mixed-methods evaluation combining (i) a modified UTAUT-based analysis to assess the acceptance and use of the DHIS2 system as a platform for NTD program data in Cameroon and (ii) a qualitative analysis to investigate challenges and facilitators associated to the use of DHIS2 by NTD stakeholders.
METHODS
Conceptual model
For the purposes of this study, we used the UTAUT model.4,5 The model is used to identify the four key factors (performance expectancy, effort expectancy, social influence, and facilitating conditions) and four moderators (age, gender, experience, and voluntariness) to predict behavioral intention to use a technology and its actual use primarily in organizational contexts.13 We adapted a model from a previous study assessing determinants of acceptance and use of DHIS2 in Kenya,9 which considered performance expectancy (PE), effort expectancy (EE), social influence (SI), voluntariness of use (VU) and training adequacy (TA) as direct predictors of behavioral intention (BI). Here, BI is the degree to which an individual intends to use DHIS2. In this model, BI, facilitating conditions (FC) and computer anxiety (CA) were assumed to be direct predictors of use behavior (UB). UB is defined as the actual frequency of using DHIS2 and average duration of each use session. This model included technology experience (TE) as a predictor of computer anxiety, and age and gender were included as moderators.
In UTAUT, BI, UB, PE, EE, SI, VU, TA, FC, TE and CA are all constructs (all earlier defined), also referred to as latent variables, and are measured through indicators which are questions on the questionnaires. BI and UB are also referred to as exogenous variables because part of their measurement comes from the other latent variables. Definition of both constructs and indicators are given in Table S1 in Online Supplementary Document.
Our modifications of the model consisted in reformulation or removal of some indicators as well as on the addition of one indicator (availability of electricity) in the FC variable, based on our experience and knowledge of NTDs and the Cameroon context.
Model reliability and validity
Reliability measured with indicators loadings was satisfactory (Table S2 in Online Supplementary Document) meaning that the constructs in the questionnaire were reliable with the latent variable they defined. However, it was necessary to drop seven indicators (TA1, TA5, FC2, FC5, FC6, CA1, and VU1) to achieve the recommended level of indicator validity since their loadings were all below the minimum recommended of 0.7.
Internal consistency reliability was overall satisfactory since both Cronbach’s alpha and Composite reliability measures were higher than the recommended minimum level of 0.7 and average variance extracted values were all above the minimum of 0.5 recommended.14,15 This means the questionnaire consistently measured the latent variables through their associated indicators (questions).
The last quality criterion of the model was the discriminant validity calculated based on the Fornell-Larcker criterion.16 This reveals to which extent a construct is empirically distinct from other constructs both in terms of how much it correlates with other constructs and how distinctly the indicators represent only this single construct. The results summarized in Table S3 in Online Supplementary Document indicate that the discriminant validity was insured since for each column the diagonal value was superior to off-diagonal values.
PLS algorithm was implemented with maximum iteration set to 300.17 Our estimation is good since the data converged only after 5 iterations, far before the maximum iteration.16
Acceptance is evaluated by the coefficient of determination or variance explained (R2) for the dependent variables behavioral intention and use behavior.
Study setting
This study was conducted in Cameroon, a middle-income developing country in central Africa. Cameroon health system is pyramid-shaped with, from the bottom to the top, the peripheral (implementation level), intermediate and the central levels (see Table S4 in Online Supplementary Document). The peripheral level is where primary data on field activities are collected, including NTD case management, and MDA. The next levels intervene in data collation, analysis, and data-driven decision-making.
Each year there would be one integrated MDA campaign against onchocerciasis and lymphatic filariasis targeting individuals aged 5 years and above; another MDA campaign for 5-14 years children against soil transmitted helminths in schools and schistosomiasis; then another MDA campaign against trachoma. For intensified disease management, there will also be a separate campaign for trachomatous trichiasis surgery, hydrocele surgery and lymphoedema management community activities.
Field activities and thus data collection for each of the campaign would last 1-2 months maximum and would cover a variable number of heath districts of the ten Regions of the country based on diseases epidemiology and funding availability. It might take a minimum of 1-3 months for the final data to be available at district, regional and central level, respectively. We note here that this periodicity contradicts with routine health facility reporting which would be weekly or monthly throughout the year. Then use cases for data in NTDs program would be specific and might require adapted data integration approaches into the national DHIS2 platform.
Study participants
The target population included all people that have a role to play in data management process for NTD programs at different levels of the health system. These are the staff of the data management team in health facilities, which later transmit data to district management team from whom it is expected to take local actions and transfer aggregated data to regional level, and central level were strategic decisions are made. Participants were recruited following a convenient sampling approach. Categories of staffs included in the sampling frame are described in Table S5 in Online Supplementary Document.
Study design and data collection
This study was a mixed-methods study. Data were collected from June to October 2019 through a self-administered questionnaire, which was based on the modified UTAUT (see Appendix S1 in the Online Supplementary Document). All questions except those collecting socio-demographic information captured responses via a 5-point Likert scale with responses ranging from ‘‘1: strongly disagree’’ to ‘‘5: strongly agree’’. To bring out richer insights on the acceptance process beyond the quantitative analyses,18 we included three open-ended questions: (i) What would you say in one sentence to reflect your understanding of “data integration”? (ii) What problem(s) do you commonly encounter in using DHIS2? (iii) What is (are) your suggestion(s) to overcome the problem(s) in using DHIS2? An additional question was included to capture other comments from the survey participants.
This questionnaire was given as a paper form and using ona.io platform, we designed a web-based questionnaire which was distributed through e-mails. We manually checked the records to avoid duplicates from paper and online forms so that each respondent completed only paper form or web form.
Data analysis
MS Excel (Microsoft Inc, Seattle WA, USA) and IBM SPSS (IBM Corp, Armonk NY, USA) statistics were used for statistical analysis of data. Validation of the acceptance model was based on a path analysis with structural equation modeling using partial least squares model (SEM-PLS) on SmartPLS 3.2.8 (SmartPLS GmbH, Boenningstedt, Germany). The mean value replacement was used as imputation method for missing data in SmartPLS.19 Path coefficients in SEM-PLS indicate the direction and strength of the relationships between latent variables. To test the significance of these relationships, bootstrapping with 5,000 subsamples with two-tailed T-statistics at 0.05 threshold for significance were ran and confidence intervals computed following the bias-corrected and accelerated bootstrap.14
For moderator analysis, we created the following groups of variables from participants characteristics: age (20-39 years vs. 40 years+), gender (male vs. female), level in the health pyramid (central and regional and district vs. health area), number of years of experience at current position (<5 years vs. ≥5 years), trained on DHIS2 (yes vs. no), using DHIS2 (yes vs. no). For each of the groups, we then ran PLS bootstrap and permutation procedures with 5,000 samples and two-tailed t-statistics with 5% significance level.
For qualitative analysis, responses of open-ended questions were extracted from the SPSS database, compiled into 4 distinct interview files and then imported into NVIVO pro plus 12 (https://www.qsrinternational.com/nvivo/nvivo-products/). In NVIVO, we did theme coding following an inductive approach,20 meaning that we tried to discover all along what was coming out from data without prior hypotheses. The coded themes were inspired from variables in UTAUT model and classified into challenges in using DHIS2 and suggestions to tackle these.
Ethics considerations
This study received ethical approval from the national ethics committee for human health research of Cameroon (see Appendix S2 in the Online Supplementary Document). Informed consents were obtained from participants prior filling questionnaires (see Appendix S1 in the Online Supplementary Document).
RESULTS
Respondent characteristics
The survey covered all the ten Regions of the country, and a total of 277 persons answered the questionnaire, 239 completed the paper forms and 38 the online questionnaire. Some questionnaires were found with missing data about participant characteristics but were not excluded from the study (see Table 1). Of the 277 participants, 268 (96.8%) were MoPH staffs, and other participants were from non-governmental organizations (NGOs) (7) and research institutions (2). 171/271(63.1%) of the participants said they were trained to use DHIS2, and 192/261 (73.6%) were using DHIS2. Table 2 presents the detailed results of the descriptive analysis.
Structural model results
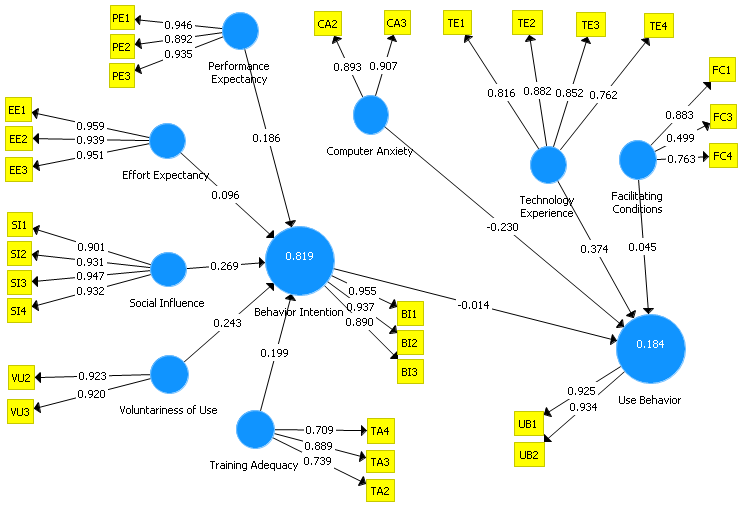
After running the PLS algorithm, we got the new conceptual model as shown in Figure 1.
_user_acceptance_model.png)
We found a value for the coefficient of determination, R², of 0.819 (95% CI: 0.784-0.859; standard error=0.019) for behavioral intention. This means that the five latent variables (performance expectancy, effort expectancy, social influence, voluntariness of use, and training adequacy) explained 81.9% of the variance of behavioral intention. The R² for Use Behavior was 0.184 (95%CI: 0.130-0.289; standard error=0.041), meaning that behavioral intention, computer anxiety, technology experience, and facilitating conditions together explained 18.4% of the variance of use behavior.
As summarized in Table 3, path coefficients (β) indicate the direction and strength of the relationships between latent variables. We found that Social Influence, Training Adequacy, Voluntariness of Use and Performance Expectancy had a statistically significant positive effect on Behavioral Intention. Social Influence had the strongest effect on Behavioral Intention followed by Voluntariness of Use. Computer Anxiety and Technology Experience had significant negative effect and positive effect on Use Behavior, respectively.
Moderator analysis
Table 4 summarizes the results of the moderator analyses. Overall, all categories within the groups were relevant for acceptance. Specifically, intention to use DHIS2 was significantly higher among males (R²: 86%) compared to females (R²: 78%), P=0.027. No significant differences were found between categories within the other groups and no significant difference was found between groups for behavioral use.
We further analyzed differences in path coefficients for each group and summarized the results in Table 5.
We found that:
-
Respondents aged 40 years and above and those with at least 5 years of experience at current position expected more performance from DHIS2 to adopt it.
-
Males appeared to be more volunteers to adopt DHIS2 than females.
-
Working at health area level was associated with increased effort expectancy towards using DHIS2.
-
People who received training on DHIS2 appreciate training adequacy as important while those not trained or not using DHIS2 would expect more performance from DHIS2.
-
People not using DHIS2 would be more prone to anxious reactions to use it.
Further details on path coefficients per categories are given in Table S6 in Online Supplementary Document.
To further investigate a potential role of participants’ characteristics on acceptance, we explored potential correlation between these characteristics and variables of behavioral intention and behavioral use (see Table 6).
We found that:
-
Level in the health pyramid was positively correlated only with Intention to use DHIS2 with smartphone/Internet (variable BI3: I plan to use [or continue to use] DHIS2 when I have access to a computer / smartphone and Internet). However, it was negatively correlated with all the variables of Behavioral Use.
-
Being trained to use DHIS2 was negatively correlated to variables of Behavioral Use (frequency of use, usage time).
-
Using DHIS2 was negatively correlated with Behavioral Use (frequency of use, usage time).
Insights from qualitative analysis
Response counts and percentages of coded themes are given in Table 7.
Challenges in using DHIS2
The most critical challenges in using DHIS2 were related to facilitating conditions. Issues in facilitating conditions were internet connection (geographical coverage, cost, quality), electricity (coverage, stability), and availability of smartphones/computers to work on DHIS2.
"Internet network coverage is often a problem. I miss the communication credit to connect to the Internet; the lack of electricity forces me to commute 23km to work." – district staff.
Challenges in performance expectancy were almost all related to DHIS2 itself, specifically internal configuration, features, definition of variables/indicators and loosing data. Loss of data was also associated with anxious reactions when using DHIS2.
“The variables and indicators for Leprosy, Buruli ulcer, Yaws, and Leishmaniasis currently found in the DHIS2 are very limited and not helpful.” – central level staff.
Suggestions to tackle challenges reported by stakeholders
The most reported suggestion to tackle the above-mentioned issues was related to improvements in facilitating conditions. Participants suggested providing wifi modems and/or lump sums to afford internet data bundle, solar panels in rural health facilities to make electricity available and computers/smartphones.
"I switch between internet networks as needed; I use my personal internet connection; Future acquisition of a new desktop computer, but in the meantime, I use my personal laptop for data entry. " – health area staff.
It was suggested to provide not only basic training on data entry but also in-depth training on data analysis including data cleaning. In addition, participants suggested looking for ways to work offline with DHIS2.
“Find a way to work offline allowing disconnecting, entering data into DHIS2 and then connecting to send.” – regional level staff.
Although effort expectancy was not found as significant predictor of Behavioral Intention, it came out from qualitative analysis that staffs suggested providing financial incentives to data management staff and to hire data clerks.
DISCUSSION
This study revealed that the UTAUT model explained 81.9% of the variance of Behavioral Intention of DHIS2. This was higher than 12-46% found by a previous study on clinician adoption of health information system in Cameron.12 Social influence had the strongest effect on Behavioral Intention followed by Voluntariness of Use while Computer Anxiety and Technology Experience had significant negative effect and positive effect on Use Behavior, respectively. Effect of social influence and voluntariness of use on acceptance is quite evident since lists of staff to attend training generally come from the hierarchy the same as instructions to use the new tool and process a data request.
Gender was the main moderator of the acceptance while age, as well as other respondents’ characteristics moderated some specific paths towards acceptance. Males would be more volunteers than females to accept DHIS2 while younger generation of staff are more willing to adopt DHIS2 than the older generation. However, through Kendall’s Tau analyses, age and gender had no correlation with specific variables of behavioral intention and behavioral use.
Effort expectancy which did not initially affect behavior intention became a strong negative factor on acceptance when moderated by the level in health pyramid. This suggest that staff in health areas would like DHIS2 to ease their work and bring them more performance in their daily work than staff of upper levels. This is true since staff in health facilities are generally overwhelmed performing curative activities at the hospital and public health duties in the field.21 Program manager could mitigate this by offering incentives and affecting data clerks in health facilities. Proper training should also be provided since our results suggest that when people are not trained the initial positive effect of social influence on acceptance would rather turn to a negative one.
Performance expectancy which at first positively affected acceptance would negatively affect it when moderated by age and number of years of experience at current position. This is coherent when we consider that older people which also have more years of experience might already have a work routine and they would expect DHIS2 to improve their ability to query data and make data-informed decisions. In other side, effort expectancy will significantly increase its positive influence on acceptance when staff are not trained on DHIS2 and thus not using it. This is understandable though somebody who has not yet been trained and is not using DHIS2 would expect that once trained using DHIS2 will bring benefits in daily work especially in context of introduction of the tool or when others around appreciate using it. Our results are consistent with a recent study in Cameroon12 which reported Social Influence as the most important predictor of Behavioral Intention in health information system adoption. Our results are also coherent with those of a previous study which reported availability of electricity supply, internet connection and additional training as some of the issues in using electronic data collection platforms.22
Although the model did not present facilitating conditions and training adequacy as strong predictors in the acceptance, the qualitative analysis highlighted these as main challenges. So, the use of a mixed-method was necessary for this study. Yet, the qualitative analysis revealed that the most critical challenges in using DHIS2 were related to facilitating conditions such as internet connection, electricity, and availability of smartphones/computers to work on DHIS2. Indeed, in 2018 in Cameroon electrification rate was 63.3%, a 1 Gigabyte monthly data plan costs in average 2000 XAF (US$3.4) and represented 2.85% of gross national income per capita beyond 2% recommended by the International Telecommunication Union.23 Even though computers could be offered, there is not so far specific budget for internet offered to users. WHO had supported from 2011 the MoPH with high speed internet connection and had provided a toll-free telephone fleet covering almost all the Regions, 181 districts and 1700 health areas in Cameroon for disease surveillance; however, this fleet was no longer functional in 2019.24
The above-mentioned challenges might hinder real time data collection using computer and smartphones during mass drug administration campaigns in the future if not resolved. However, the system is functional because users invent individual and collective practices. At individual level, health personnel temporarily move to places where they could have access to electricity and internet. They sometimes buy from their pocket a smartphone and/or a computer and internet data bundle to be able to perform the task. Moreover, staff in health facilities would send their paper forms to district data managers who will enter the data into the system. All this might contribute to explain why, albeit the gap between behavioral intention and behavioral use, and the fact that while some people are not trained on using DHIS2, people are using the system. Such behavior might be motivated by a pressure from the system to respond to data requests addressed by the hierarchy. In Cameroon, we noted that the minister of public health had issued letters to health personnel to make the use of DHIS2 mandatory.
Limitations
Some values below the recommended thresholds affected the internal reliability and convergent validity of data. This could be due to a possible regression toward the mean in the treatment of missing data and the understandability of some of the questions. For example, the question VU1 contained a negative formulation which made it difficult to understand, thus raising again the question of contextualization of the UTAUT model.8,12 Our results might also be limited by a sampling bias since we used a convenience sampling rather than a stratified sample.
Policy implications and recommendations
There was a clear intention to use DHIS2 among study participants, but effective use would not follow partly because of facilitating conditions. We therefore recommend that NTD programs should consider providing monthly internet connection lump sums to health personnel during integration process. This will be critical during training workshops and live-monitoring campaigns during which users will need to access to the DHIS2 platform to exercise. In practice, choice should be given to users in remote areas to specify which network is the best so that sim cards will be provided accordingly. Ideally, modems provided should be flexible (work with 2G-3G-4G) since some areas might neither be covered with 3G nor 4G network, otherwise the modem would be unusable. In addition, the modem should not be tied to a specific telecom operator but should rather leave chance to the data manager to switch to the best available network anytime as needed. Directly providing data bundle or communication credit for one operator is a risk if the operator’s network is down for days or does not cover the area. Since internet cost is still high, concerted efforts of government bodies and telecommunication operators plus consumer league will be required to lower internet cost for end-users over the time. This appeals to a multi-sectorial politics beyond the scope of this paper.
Our results suggest that people not using DHIS2 are more prone to anxious reactions (i.e. being intimidated) by DHIS2 and expect more performance from DHIS2 for their daily work. Then, during training sessions, trainers should explain, with context-specific examples, how far DHIS2 would increase trainee’s performance at work and share hints that could ease the use of DHIS2. Training sessions of NTD program data managers at all levels to enter data into DHIS2 should allow enough time for practice and feedback from end-users. By doing this, system administrators and program staffs could improve system features, e.g. make changes on indicators or data entry forms. We recommend complementing these sessions with follow-up meetings for central level staff and on-site mentoring for field staff. In subsequent years, training sessions could be shortened to approximately 2 days and incorporated with usual MDA field training sessions. These training and mentoring sessions should also include interpersonal communication to reduce anxious reactions from users and should consider training needs of trainees. For instance, training agenda would include pre and post-tests plus daily evaluations.
The issue of power grid will be the more difficult to tackle directly since it is out of the responsibility of the MoPH. However, the MoPH will have to find ways for providing health facilities with alternate power generator or solar panels when possible.
Further research
List and effect of moderating factors in UTAUT as well as statistical methods to analyze them are still under debate.25,26 Further research could confirm moderating effect of training/using DHIS2 status, level in the health pyramid and number of years at current position. Moreover, statistical analyses of the model alone might not capture main challenges in acceptance such as facilitating conditions. Thus, quantitative analyses of DHIS2 acceptance with UTAUT model should be complemented with a qualitative analysis.
This paper reported a mixed-methods evaluation focused on acceptability, which we recognize as only one dimension in applicability along with cost and feasibility. Further research could assess the cost of the integration process itself, the best data integration approach as well as its effectiveness so that policy makers and implementers would have more insights in a perspective of replication and roll out.
CONCLUSIONS
The present mixed-methods evaluation revealed that the acceptance to use DHIS2 for NTD program between NTD stakeholders in Cameroon was high. However, DHIS2 actual use might mainly be challenged by facilitating conditions such as internet connection, electricity, and availability of smartphones/computers. We therefore recommend to NTD program managers to plan for adequate support in providing proper training, internet modems with data bundle and smartphones/laptops to ease use of DHIS2 by NTD stakeholders.
Acknowledgements
We would like to express our true appreciation to Mohamad Anouar-Al-Sadat and Guy Ekani Ndongo from the MoPH for their help and insights to this work. We also express all our gratitude to Serge Akongo from Sightsavers International and Dr Paul Tonkoung from Helen Keller International who helped in collecting data in some districts of the West and Far North Regions where we had not been able to go. We are also thankful to Anne-Claire Peultier, PhD candidate at Erasmus School of Health Policy and Management, Erasmus University Rotterdam, and Ransome Bawack, PhD Fellow at Toulouse School of Management, Université Toulouse 1 Capitole, France for their proof reading of this article.
This study received ethical approval from the national ethics committee for human health research of Cameroon (see Appendix S2 in the Online Supplementary Document).
The authors alone are responsible for the views expressed in this article, which do not necessarily represent the views, decisions, or policies of the institutions with which they are affiliated.
Funding
This publication was supported by a grant from the United States Agency for International Development (USAID) and UK aid from the British people (UK aid) through the Coalition for Operational Research on Neglected Tropical Diseases (COR-NTD) and administered by the African Research Network for Neglected Tropical Diseases (ARNTD). Its contents are solely the responsibility of the author(s) and do not necessarily represent the views of USAID, UK aid, COR-NTD or the ARNTD. We also received complimentary funds from Sightsavers International – Cameroon to conduct some field data collection and Helen Keller International for a data pre-validation meeting. The funders have no role in study design; in the collection, analysis, and interpretation of data; in the writing of the report; and in the decision to submit the article for publication.
Authorship contributions
This study was designed by HCM, with inputs of all authors. Data collection and analysis were carried out by HCM and HCND. All authors contributed to interpretation of findings. The manuscript was written by HCM with input from all authors.
Competing interests
The authors completed the Unified Competing Interest form at http://www.icmje.org/disclosure-of-interest/ (available upon request from the corresponding author) and declare no conflicts of interest.
Correspondence to:
Henri C Moungui, ICAP at Columbia University in Cameroon, Maroua, Cameroon (Henri was affiliated with CRFilMT and Ministry of Public Health during the period of study design, implementation, reporting and manuscript writing).