

In 2019, 18 infants out of every 1,000 live births died in the neonatal period (the first 28 days of life) globally,1 which accounts for almost half of all children who die before the age of five.2 The distribution of deaths was unequal, with neonatal mortality rates (NMR) being highest in sub-Saharan Africa, 28 per 1,000 live births.1 Target 3.2 of the United Nations Sustainable Development Goals (SDGs) aims to reduce NMR to at least as low as 12 per 1,000 live births in 2030.3 Current trends suggest that over 60 countries will miss this target.2 This is especially worrying, since many neonatal deaths could be avoided with simple interventions focusing on the needs of women and newborn care around the time of birth.4
Preterm birth and intrapartum complications contribute to neonatal deaths.5 The prevalence of preterm birth varies between countries and regions but globally estimated to be 11%6; around 80% of total global number of preterm births are occurring in South Asia and sub-Saharan Africa (SSA). Low birth weight (LBW, <2,500g regardless of gestational age) is the single most important cause of neonatal deaths,7 and more than 80% of annual neonatal deaths can be associated with LBW.5,8 It can be caused by both preterm birth and intrauterine growth retardation; in-door and out-door air pollution at the household level are considered to be significant contributor, particularly in SSA.9 Furthermore, slow foetal growth can lead to babies being born small for gestational age (SGA).10 The most common definition of SGA is birthweight below the 10th percentile for gestational age.11
Most neonatal deaths associated with inadequate quality of care around the time of childbirth are preventable with proven, cost-effective interventions.2,12 At the turn of the century, 62% of all births worldwide occurred with a skilled birth attendant (SBA)13; in 2019, it was estimated that 81% of all deliveries were institutional births.14 Complete coverage of SBAs and resuscitation equipment is, however, not enough; the quality of other types of care must be adequate as well. Studies have shown that due to a lower rate of delivery care in SSA and Asia, neonates do not always benefit from skilled birth attendance.15,16
Although significant progress has been made in ensuring competent care during birth, NMR is still declining too slowly. Several studies have emphasised the need for interventions to enhance the quality of healthcare during childbirth further to lower NMR17–19; recent assessment on the quality of care during birth in Kenya and Malawi indicated great opportunities for quality improvement, including increased staffing, higher-volume facilities and promotion of respectful care.18
During the Millennium Development Goals (MDGs) era, progress was made globally in lowering the mortality rate of children under five years of age (U5MR).4 Despite its meagre economic resources, in 2010, Malawi was one of the few Countdown 2015 countries to consistently achieve yearly rates of reductions in U5MR of 4.5% or more.20 The country was one of the first in SSA to achieve the MDG to reduce the U5MR by at least two thirds (from 175 deaths per 1,000 children in the year 2000 to 55 in the year 2015), and successful in improving the NMRs from 41 in 2000 to 23 in 2016.21 This success has, for example, been linked to improvements in quality of care around birth.22 However, to achieve the SDG Target 3.2, the pace of progress needs to accelerate,23 including strengthened infra-structure and improved hospital neonatal care.
The study aimed to describe neonatal care in a low-income setting, a district hospital in Malawi, in this exact case. In particular, the specific aim was to explore neonatal care services in the hospital before and after upgrading of infrastructure to answer the following question: To what extent can an improved infrastructure in the setting impact neonatal care provision?
METHODS
Study setting
The study took place in the nursery department at Mangochi District Hospital (MDH), Malawi. The country has a population of just over 18.6 million,24 and 28 districts, one of them being Mangochi, a population of around 1.2 million. Women of childbearing age are about 280,000, 23% of the people, and the expected annual number of deliveries is around 61,000.25 MDH is situated in the largest town of the Mangochi district, Mangochi Boma. The hospital provides primary level health care to a population of about 300,000,26 while serving the entire district with secondary health care services.
Since 1989, the Icelandic International Development Agency (ICEIDA) has collaborated with the Government of Malawi.27,28 Since 2012, the cooperation is directed to Mangochi District with a focus on public health, primary education, adult literacy and water and sanitation.28,29 From the outset, the collaboration aimed to improve infrastructure and equipment for maternal and neonatal care in MDH and other selected health facilities in line with national guidelines, supported with appropriate staff training in the district and ambulance services. On January 31, 2019, a new maternity wing at MDH was inaugurated as part of this collaboration, including a new nursery for neonatal care. Table 1 summarises the situation regarding space, staff, and equipment in the old nursery before the inauguration compared to the new nursery.
Data collection
Quantitative data
In the period February 20, 2020, to March 11, 2020, one of the authors (IH) collected data in the nursery ward of MDH. Information was retrieved from the nursery registry book on all neonates who had been admitted in the period July 1, 2018, to December 31, 2019. The variables extracted and used in the study included the place of admission (old or new nursery), place of birth, age of mother, gender, admission month and year, gestational age, birth weight, diagnosis, outcome and length of stay.
The admission rates were compared using a binomial test. Means of monthly admissions were only compared for the same months in successive years 2018 and 2019 of the two nurseries: the old nursery and the new nursery, with a significance level of 0.05, to avoid effects of seasonal change in admission rates. Data were available on five joint months from the two nurseries, i.e., July, August, September, November and December.
Gestational assessment national data from Malawi was used as a reference to analyse data on infants who were SGA. As the national reference data was split into two groups by the age of the mother,30(p12) the mean of the reference value of birth weight in the two maternal age groups was calculated for comparison due to lack of information on the age of the mother in our study. We assumed a normal distribution of the population and calculated the 10th percentile to categorise SGA infants. The chi-square test, with a significance level of 0.05, was used to assess the difference in survival of SGA infants.
Observational data
During the field visit, February 20, 2020, to March 11, 2020, one of the authors (IH) was in continuous contact with nursery staff. While observing ward routines and engaging in informal discussions on their work and provided services, open-ended semi-structured interviews were conducted with four staff members.
Ethics
This study was granted permission by the Mangochi Health Research Committee, in Mangochi, on February 25, 2020, with one of the authors (BF) assigned as a supervisor for collaboration with MDH and the District Health Office during the study period.
Statistics
Extracted data were compiled in Excel (Microsoft Inc, Seattle WA, USA) and analysed using the statistical computing program R (R Foundation, Vienna, Austria) and JMP 14.3 (SAS Institute, Cary, NC, United States). A t-test was used for comparison of length of stay between the two nurseries and the difference in the proportion of missing values between nurseries was assessed with a chi-square test. Comparsion of survival rates in the two nurseries was done in a nominal logistic regression model that takes missing values into consideration. Significance level was set at P<0.05 and odds ratio (OR) calculated with 95% confidence intervals (CI).
RESULTS
Nursery registry book
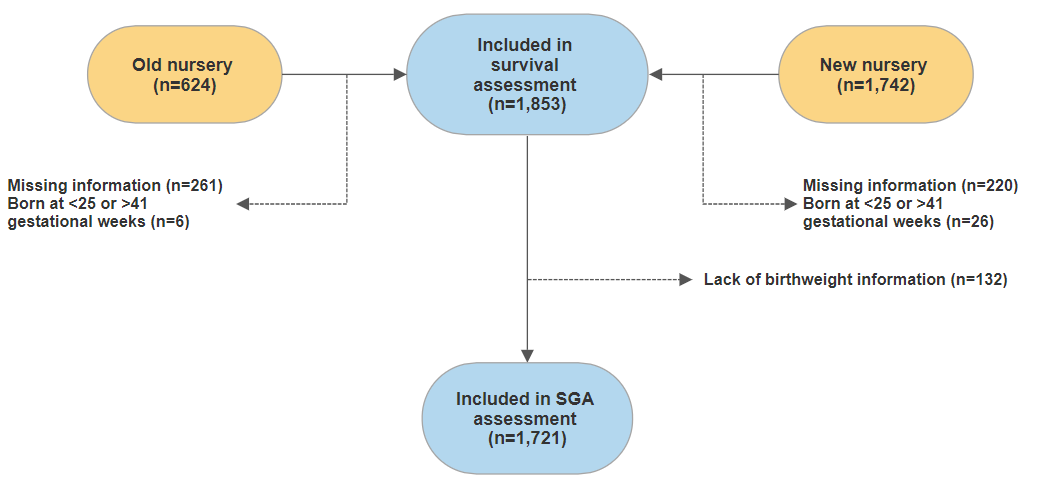
From 1 July 2018, until 31 December 2019, there were 2,366 admissions of newborns registered in the nursery registry book; there were no entries in October 2019. From 1 July 2018 to 30 January 2019, there were 624 admissions; in the new nursery, from 31 January to 31 December 2019, there were 1,742 admissions. Figure 1 shows the information on admitted newborns that were included in the study.

Information from registry books from the same months in successive years 2018 and 2019 in the two nurseries was used to compare the number of admissions between the old and the new nursery, that is July, August, September, November and December. Admissions more than doubled in the period; on average, there were 86.4 monthly admissions (median 87; range 41-124) in the old nursery compared to 177.4 (median 186; range 128-218) in the new nursery (P<0.001).
Missing values in the registry frequently occurred for admitted newborns during the study period (Table 2). Missing values for all the selected variables were significantly higher in the old nursery than the new one. Overall, outcome values were not available for 716 neonates out of the 2,366 (30%) in the study group. Information on selected variables is shown in Table 3. Excluding missing values in the registry, infants in the new nursery were more likely to have been born at the MDH compared to those in the old nursery; in total, 85% of infants in the new nursery were delivered in MDH compared to 73% in the old nursery (P=0.004). The average length of stay also increased significantly in the new nursery, from about 2.6 (median 1.0) to 3.6 days (median 3.0, P<0.001).
Admission diagnoses
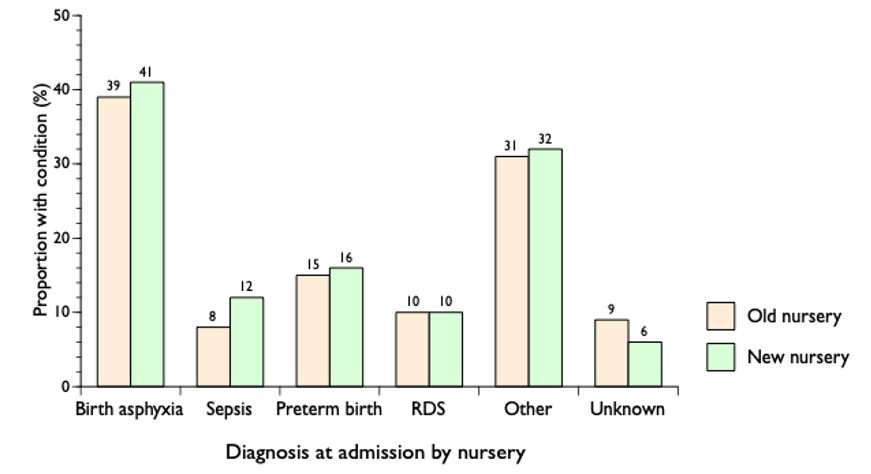
Diagnosis at admission was missing for 158 (7%) out of 2,366 infants in the registry book (Figure 2); some neonates got more than one diagnosis. Birth asphyxia was the most common admission diagnosis or in about 40% of the admitted neonates; a diagnosis of sepsis increased by 50% in the new nursery compared to the old one while the category of unknown decreased by one third.
Preterm and small for gestational age infants
When assessing the number of babies born SGA, 645 (27%) infants were excluded (Figure 1). In Figure 3, the blue ribbon around the mean green slope indicates the 10th to 90th percentile of birthweight by gestational age, and dots under the 10th percentile are babies born SGA. Of the 1,721 (73%) infants with information on birth weight and gestational age, 311 (18%) were born SGA.

Survival rates
When comparing survival rates in the two nurseries, all 2,366 admissions were included in a nominal logistic regression model. Infants admitted to the new nursery were 4.27 times (95% CI=3.20-5.72) more likely to survive compared to those admitted to the old nursery (P<0.0001).
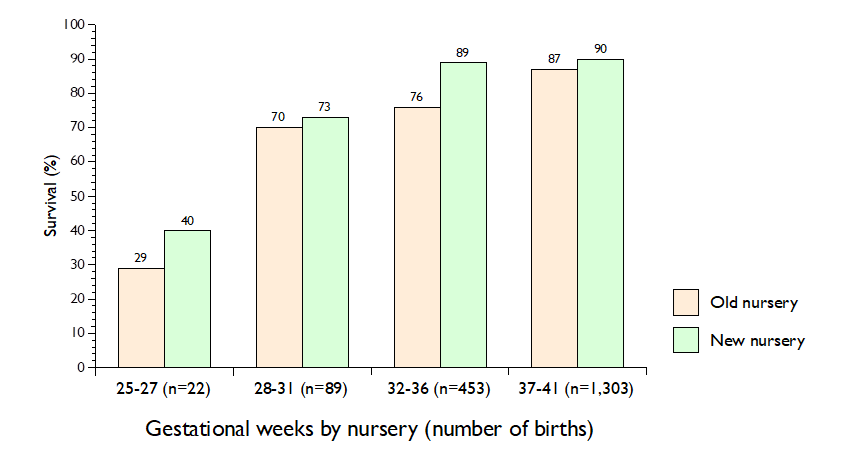
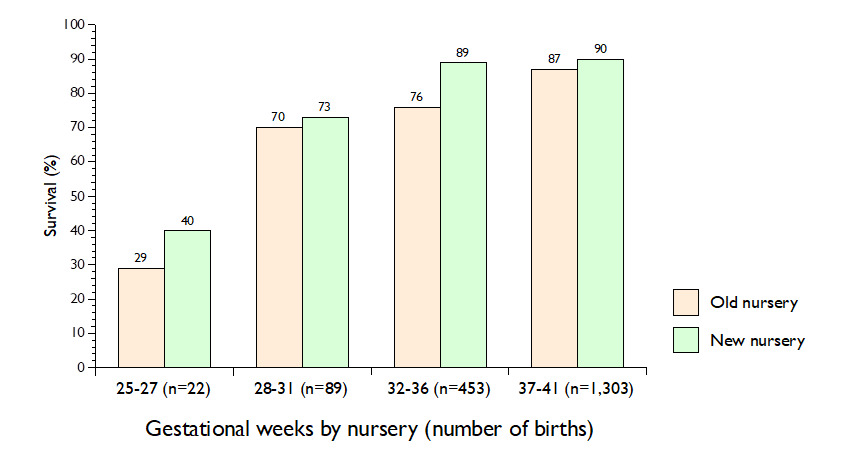
When survival rate by gestational age was assessed, in total, 1,853 neonates born between week 25 and 41 were included (Figure 1). Survival rates improved with higher gestational age, and about nine out of ten term infants (≥37 weeks) survived (Figure 4) given that all infants with missing information on outcome had survived.
In total, 74% of all SGAs in the old nursery survived compared to 84% in the new one; in a nominal logistic regression model, infants born SGA were 5.46 times (95% CI=3.67-8.11) more likely to survive in the new nursery compared to the old one (P<0.0001).
Working conditions
Conversations with staff with variable work experience indicated several important issues for them to improve the services. The most significant was the shortage of staff that contributed to increased workload and more shift work. Lack of equipment was a persistent problem (e.g., incubators and equipment for preterm babies) with regular stock-out of supplies (e.g., equipment for measurement of glucose and bilirubin, orogastric tubes, vitamin K and 50% dextrose). The new facilities were appreciated and had given opportunities for specialisation within the ward, better monitoring of each newborn, and had contributed as well to better management of data.
DISCUSSION
This study describes the context of newborn care in a district hospital in a low-income SSA setting and analyses the flow and outcome of newborn babies in two neonatal nursery wards, i.e., one in old premises, the other in a recently inaugurated facility. The results indicate that improved infrastructure following the construction of a new maternity wing in MDH, including better space for the care of neonates, more and trained staff and appropriate equipment, may have contributed to improved survival of neonates (Table 1). Further, the expanded infrastructure facilitated the implementation of processes known to improve the quality and outcome of neonatal care, e.g., KMC (Kangaroo Mother Care) and isolation units and better equipment such as CPAP (Continuous Positive Airway Pressure), radiant warmers and resuscitation machines with the backup of solar energy.
Following the inauguration of a new maternity wing at the MDH, admissions have more than doubled, and a higher percentage of newborns were born there compared to the period before the construction. This increase might indicate that more women were attracted to seek SBA in the new facilities at MDH. In addition, the proportion of sepsis diagnosis at admission increased by 50% in the new nursery compared to the old one (Figure 2) which might indicate better attention of staff to symptoms of neonatal infection with access to isolation facility in the new nursery. Globally, the prevalence of SBA has been increasing,14 with global rates estimated at 81% compared to half of the deliveries in Africa,15 but studies have highlighted the importance of SBAs to lower neonatal mortality.16,31
Although the proportion of SBA is rising in MDH, our results indicate its full benefits are not reaching the mother and child due to poor implementation of evidence-based interventions. A study from 2017 on health facilities in Malawi demonstrated that newborns in the Southern region, including Mangochi, were not receiving the same quality of care as in the Northern region, the critical problem being lack of staff training.32 Health care providers highlighted that new nursery facilities with specialisation might have enhanced the monitoring of newborn babies in the ward, while there was still room for improvement.
Data management and storage
One crucial result this study has enunciated is the lack of registration and data storage (Table 2). This is in line with the results of an assessment of data from the Health Management Information System (HMIS) in Malawi that demonstrated that missing information is a severe threat to the Malawian HMIS.33 However, missing values were proportionally fewer in the new nursery than the old one (Table 2), indicating improvement of data management and highlighted by staff. Still, no computerised data on the services in the MDH nursery were available in the HMIS during the study period. To achieve SDG Target 3.2, data collection and storage on neonatal care must improve. Mismanagement of data is a widespread problem; a study conducted in Monkey Bay, one of five health areas in Mangochi District, identified similar difficulties regarding overall data management and storage.28 To support quality improvement in the setting, it is vital to have good baseline data to guide policy and assess which cost-effective interventions are best suited to tackle neonatal mortality in different settings, similar to initiatives elsewhere.34
Strengths and limitations
One of the strengths of this study is that it addressed different aspects of the services provided at the MDH nursery with a clear division of data analysed before and after the inauguration of new labour ward and nursery facilities and offers viewpoints from health care providers. Thus, the results contribute to improving neonatal care in the MDH and giving a baseline to monitor progress in the district and Malawi to get on track with the SDGs that aim to lower the NMR worldwide.
The main limitation of this study is the multitude of missing values (Table 2). Nearly as many neonates were reported dead and as those discharged at the old nursery. Therefore, the data may indicate that the staff registered every death, while discharge information was deemed less important to record in the registry book. These assumptions derogate the findings of an improvement in the survival rate in the new nursery compared to the old one and may have introduced bias into the results. Yet, by application of nominal logistic regression model that took missing values into consideration, there was statistically significant difference in survival rates for admitted infants to the new nursery compared to the old one, also for infants born SGA. Nonetheless, the multitude of missing values is a limitation to our study and an important result by itself. Our results are in line with previous studies in the setting,28,33 and call for dedicated efforts to improve registration at admission, during the hospital stay, and at the time of discharge. Another limitation of the study is the focus on only one out of three commonly used indicators, defined initially by Donabedian, to evaluate the quality of healthcare, i.e., infrastructure (ward, staff and equipment).35 Further research is needed to assess clinical processes, e.g., specific interventions in the care of neonates, to identify those that most effectively and efficiently improve outcome in the care of sick neonates in the setting.
CONCLUSIONS
Changes in the neonatal care in MDH following the opening of a new nursey has increased the number of admissions; the newborns stay significantly longer in the ward, and their survival rate has improved. The study indicates that more mothers and newborns are being reached, an essential indicator of access to delivery with SBA and neonatal services when needed. However, the health workforce gap is a severe obstacle to further improving neonatal services, in line with the SDGs, coupled with more qualified staff and continuous staff training. High-impact, cost-effective interventions have to reach every mother and their newborn child and optimal use of available resources must be ensured through a continuum of care and improved monitoring of outcome. Neonates born at risk in poverty-stricken settings need local and global attention – and action – if the SDG Target 3.2 is to be achieved by 2030.
ACKNOWLEDGEMENTS
We are grateful for all the help provided by the staff of the District Health Office in Mangochi. Special thanks go to the Mangochi Health Research Committee that gave permission to conduct the study, and the staff at the MDH nursery for all their cooperation and support The assistance and logistic support that was given by the Embassy of Iceland in Malawi, particularly the staff at the Mangochi office, is appreciated; special thanks go out to Kristjana Sigurbjörnsdóttir and Lilja Dóra Kolbeinsdóttir for their invaluable support. Finally, we want to thank Eyþór Eiríksson, Steinþór Árdal and Stefán Þór Gunnarsson for their help with statistical analysis.
FUNDING
The research was supported with a grant from the Faculty of Medicine at the University of Iceland.
AUTHORSHIP CONTRIBUTIONS
IH: Conception and design of the study, analysis and interpretation of data, drafting and revision, final approval and agreement to be accountable for all aspects of the work.
BF: Acquisition and interpretation of data, revision, final approval, and agreement to be accountable for all aspects of the work.
TT: Analysis and interpretation of data, revision, final approval and agreement to be accountable for all aspects of the work.
GG: Conception and design of the study, interpretation of data, revision, final approval and agreement to be accountable for all aspects of the work.
COMPETING INTERESTS
The authors completed the Unified Competing Interest form at www.icmje.org/coi_disclosure.pdf and declare no conflicts of interest.
CORRESPONDENCE TO:
Geir Gunnlaugsson
Faculty of Sociology, Anthropology and Folkloristics
Oddi-319, Sturlugata 3
University of Iceland, IS-102 Reykjavík, Iceland
Email address: [email protected]