As one of the fastest developing countries in Southeast Asia, Nepal is currently in a transition from infectious diseases to non-communicable diseases (NCDs) as its major public health concern.1 The most recent data suggests that NCDs account for 60% of all deaths2 and 80% of outpatient care in Nepal,3 with chronic obstructive pulmonary diseases (43%) and cardiovascular disease (40%) the most common, followed by diabetes mellitus (12%) and cancer (5%).4 According to the World Health Organization (WHO)5 and a 2015 study by Bishwajit,6 political instability, economic discrepancies, high unemployment, low education, unhealthy lifestyle behaviors, and indoor air pollution are all risk factors for NCDs in Nepal. Alcohol abuse and tobacco use are also particularly prevalent in the population.2,7 A 2011 paper by the World Bank states, “the accelerated urbanization [in Nepal] with limited resources and globalization of processed food contribute to the increase of unhealthy lifestyle habits that perpetuate the cycle of chronic illness, debt and poverty,”8 and indicates that addressing NCDs is the next major health challenge for Nepal.
In response to this rising burden of disease, the WHO outlined strategies for the management of NCDs for low-and-middle-income countries such as Nepal in the “2008-2013 Action for the Global Strategy for the Prevention and Control of Noncommunicable Diseases.”9 One strategy outlined in the publication is the implementation of “lifestyle,” or integrated, clinics that are designed to encourage a community-based approach to research, educate, prevent, and treat NCDs. In these clinics, primary healthcare workers are retrained to recommend nutritional and lifestyle counseling in an integrative, patient-centered care setting to promote an economically and socially favorable system of healthcare.10 Countries in Latin America, Africa, Central Asia, and Southeast Asia have successfully implemented lifestyle clinics that address modifiable everyday behaviors based on the WHO model.11,12 Research also indicates a significant decrease in chronic disease mortality when behavioral risk factors are replaced with healthy lifestyle choices.13–15 A leading example is the implementation of the WHO model in Sri Lanka. The Sri Lankan Ministry of Health established NCD interventions in primary clinics throughout the Badulla district from 2009 to 2011, initiating 126 Healthy Lifestyle Centres (HLCs). The number of HLCs increased to 826 by 2016.10,16
The WHO STEPwise approach to NCD risk factor surveillance5 highlights the necessity of conducting baseline population surveys as a means of identifying the most pressing risk factors and informing interventions for NCD control and prevention, including lifestyle clinics. In particular, the collection of population data following a surveillance approach such as STEPwise allows for 1) the collection of data across and within countries, 2) comparisons of data over time and across countries, and 3) health services to determine priorities and plan appropriate disease interventions.
As is the case in many low-income countries,16 the initial NCD surveillance surveys are often conducted by well-situated non-government organizations (NGOs) with the resources, regional understanding, and established relationships to enable the successful collection of data. In Nepal, one such organization is Good Health Nepal (GHN), an NGO founded in 2008.17 The GHN clinics, staffed with additional volunteers from the Acupuncture Relief Project (ARP), serve a population of approximately 120,000 villagers who travel up to four hours by foot each way to receive treatment, urgent care, and medical referrals. Since it was founded, GHN/ARP, with prioritization of patient education and disease prevention, has provided more than 350,000 patient visits within the clinic’s catchment area in the Makwanpur District.
Anecdotal evidence from GHN/ARP suggests that the burden of NCD is high in this region; however, no data currently exists on the patient demographics, NCD type, prevalence, or regionally-specific risk factors. Utilizing its resources, regional understanding, and established relationships with the local community, GHN/ARP conducted a door-to-door survey to establish baseline population characteristics and prevalence for adult NCDs in five of the fifteen wards in Thaha Municipality, Makwanpur District, Nepal (GHN/ARP’s current catchment area in Bajrabarahi, Thaha).
METHODS
Overview
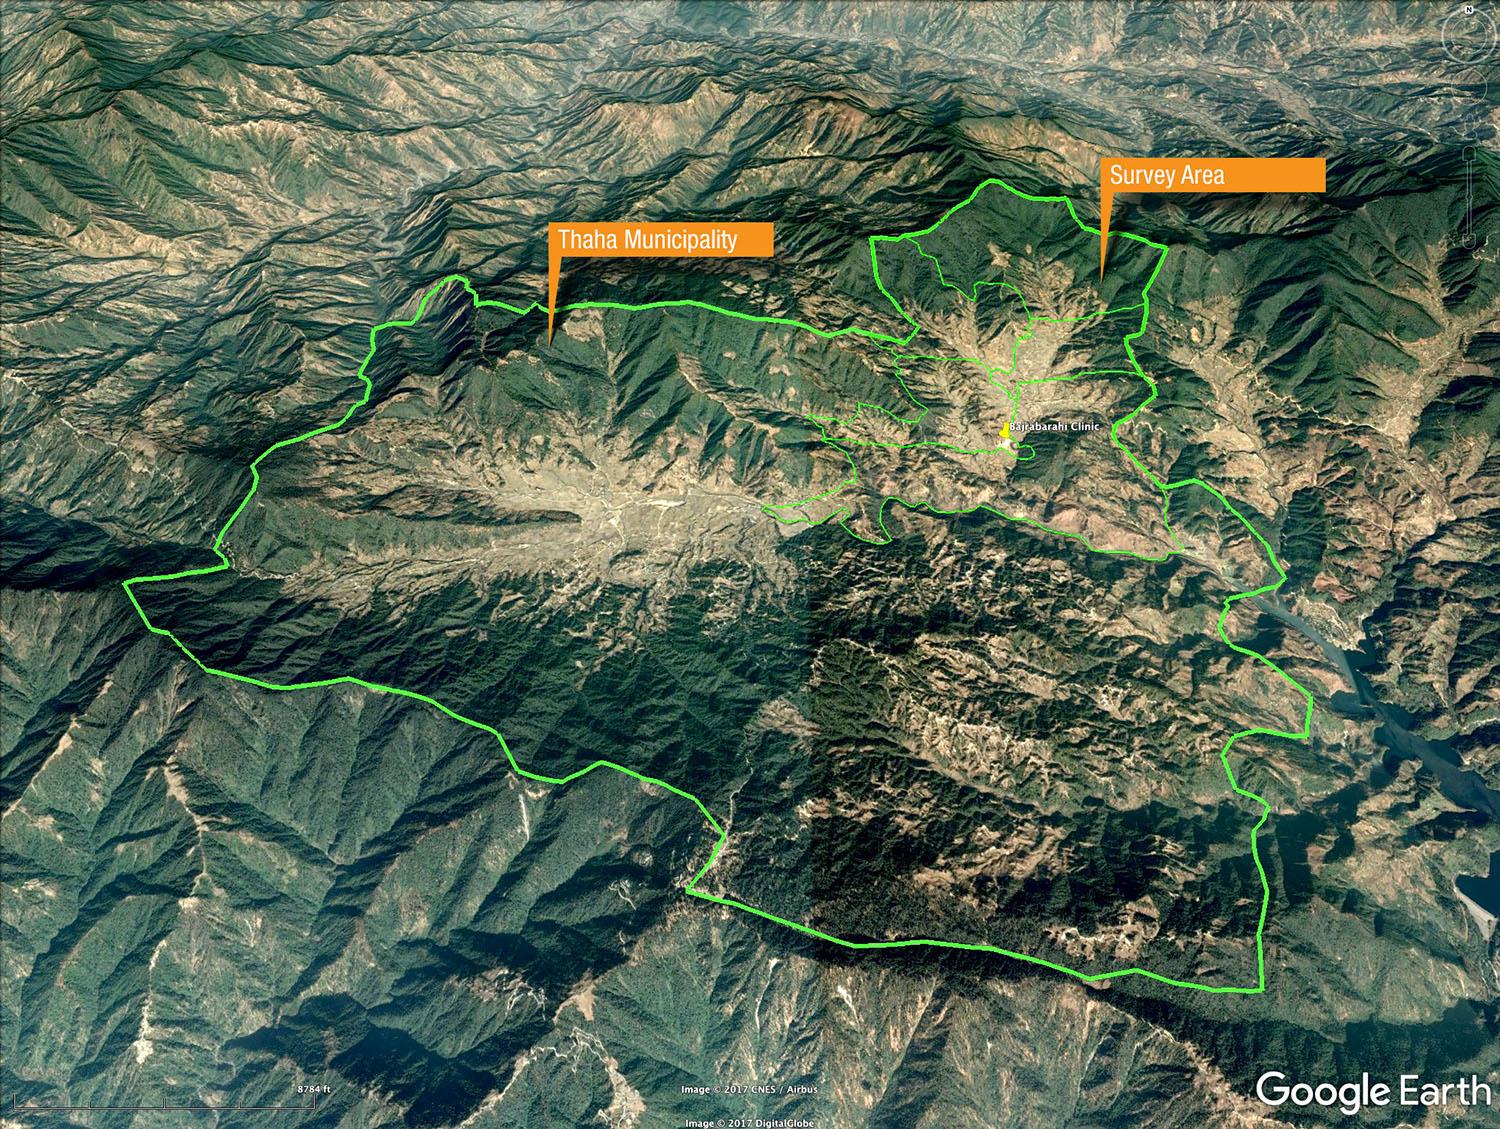
The study was conducted in Nepal, encompassing five wards (Wards 11-15) of the Thaha municipality in Makwanpur District with a combined 2011 population of 7,675. These five wards occupy approximately 10 square miles (26 square kilometers) (Figure 1) and contain an estimated 1,630 households and a total population of 7,675 (a cross-sectional population of 5,066) according to a 2011 census. A more detailed, census-type survey of all residents within the selected wards, rather than a representative sample, was determined to be feasible and preferable in terms of scope and detail for this study.18,19 Data was collected using the WHO STEPwise approach to NCD risk factor surveillance instruments (STEPS) via a cross-sectional survey.20

Door-to-door survey acquisition was conducted between November 18th and December 21st, 2018. Five teams surveyed 10 households each day, thus 50 households were interviewed a day for approximately one month (i.e., 30 days). 2,903 individual records and 1,346 household records were captured.
Inclusion and exclusion criteria
All adults nineteen years and older according to Nepalese counting methods were allowed for inclusion. The age cut-off of nineteen years by traditional Nepalese counting methods defines a population of adults who are eighteen years and older by traditional European counting methods.
Children below the age of nineteen according to Nepalese counting methods were excluded, as were adults with an inability to communicate directly with interviewers and adults who declined consent.
Household identification and tracking
An aerial grid map of the region was employed to track households in the survey area. A numbered sticker was placed on the door of each household surveyed and a logbook of individuals associated with this numbered household was kept to ensure all possible individuals were interviewed. Social workers with local knowledge of the area were employed to introduce research teams to residences and ensure all areas were visited.
Study coordination and facilitation
This study was implemented in coordination with the Nepal Health Research Council (NHRC). The NHRC oversees the conduct of research in various fields relating to health within Nepal, aligning with the health priorities identified by the National Health Policy of the Government of Nepal.
Surveys
To collect study data, two questionnaires (Head of Household and Individual), along with physical and biochemical measurements, were used during in-person interviews. Electronic tablets loaded with both survey instruments on the REDCap platform were utilized by survey teams. Questionnaire items and content were adapted from WHO STEPwise resources, previous population studies performed by the Patan Academy of Health Sciences, and the National Institutes of Health’s (NIH) Patient-Reported Outcome Measurement Information System (PROMIS) questionnaires.
Every interviewer was fluent in Nepalese and each encounter began by obtaining verbal and written consent for the survey interview. At the start of the interview and prior to each biomarker measurement, each participant was given the option of declining participation in all or part of the study.
Head of household questionnaire
The head of household questionnaire (Online Supplementary Document) consisted of 162 questions on dwelling characteristics, including construction materials, electricity, plumbing, kitchen, garbage management, travel distance to the nearest health post and hospital, and method of transportation. Other household variables included source and proximity to drinking water, technology, land ownership, livestock, food security, and recent deaths within the household. Items in the Head of Household Questionnaire were adapted from the WHO STEPS and were used in the 2012-2013 Nepal NCD surveillance.22 The Head of Household Questionnaire took approximately 25 minutes to complete.
Individual questionnaire
The individual questionnaire (Online Supplementary Document) consisted of 163 questions on sex, Nepali and Western birth date, current age, general health, tobacco and alcohol use, medication use, health post or hospital use for common NCDs within the prior two weeks or prior year, past acupuncture use and experience, ability to work, and individual health factors. The health factors included participant-reported paralysis, pain, diabetes, high blood pressure, and mental health. Items in the individual questionnaire were adapted from the WHO STEPwise resources, which were used in the 2012-2013 Nepal NCD surveillance,22 and the PROMIS tools for general health (v1.2), pain interference, and cognitive function (Short Form 8a). The Individual Questionnaire took approximately 25 minutes to complete.
Biomarkers
Measurements included in this survey are outlined in the WHO STEPs Surveillance Manual.20 Biomarkers included the waist-to-hip ratio as an indicator of obesity, blood pressure, heart rate, blood oxygen saturation levels (SpO2), respiration rate, and blood glucose. The interviewers implemented standard practices to gather objective health measures and adhered to the guidelines established by the WHO for NCD risk factor surveillance. When possible, physical measurements were conducted in a private area based on participant preferences.
Data collection
Team Training
To assure consistency between interview teams, a week-long training was organized for all study personnel prior to the start of data collection. The training focused on interview techniques, sampling processes, household and individual selection, the use of the survey paper and electronic forms, survey ethics, respondent protections/confidentiality, and proper management of collected data.
Collection and storage
Interview teams utilized tablets with encrypted electronic versions of the questionnaires prepared in REDCap (projectredcap.org). Study data was collected and managed using REDCap electronic data capture tools hosted on a HIPAA-compliant external server hosted by the Oregon College of Oriental Medicine.23,24 REDCap (Research Electronic Data Capture) is a secure, web-based software platform designed to support data capture for research studies, providing 1) an intuitive interface for validated data capture, 2) audit trails for tracking data manipulation and export procedures, 3) automated export procedures for seamless data downloads to common statistical packages, and 4) procedures for data integration and interoperability with external sources.
Participant protection and security
This study adhered to the utmost ethical standards including privacy, respect, and rights of the participants. All individuals with significantly abnormal biomarkers identified during the course of the survey were immediately referred to the local health post for further evaluation. All interview participants of the study received a verbal Informed Consent Agreement prior to initiation of the interview. The Informed Consent Agreement stated the purpose of the survey, what was involved in participation, confidentiality, and who was organizing the study. Interview participants provided verbal and written consent prior to being interviewed.
Translation process
Translation and back-translation of surveys and results followed the protocol outlined in the WHO STEPwise Surveillance Manual.20 The initial translation of material was conducted by the District Public Health Officer. Questions were translated to the most appropriate equivalent term in Nepalese, and, when needed, alternative terms were suggested by the District Public Health Officer to enhance comprehension of material by the local population. An independent translator from the Tribhuvan University was selected to back-translate the instruments into the original language (i.e., English) to ensure accurate reproduction of meanings. No “interpreters of convenience,” such as members of the participant’s family or household, the village headman, or any other convenient person present, were utilized during the interview process.
RESULTS
Demographics
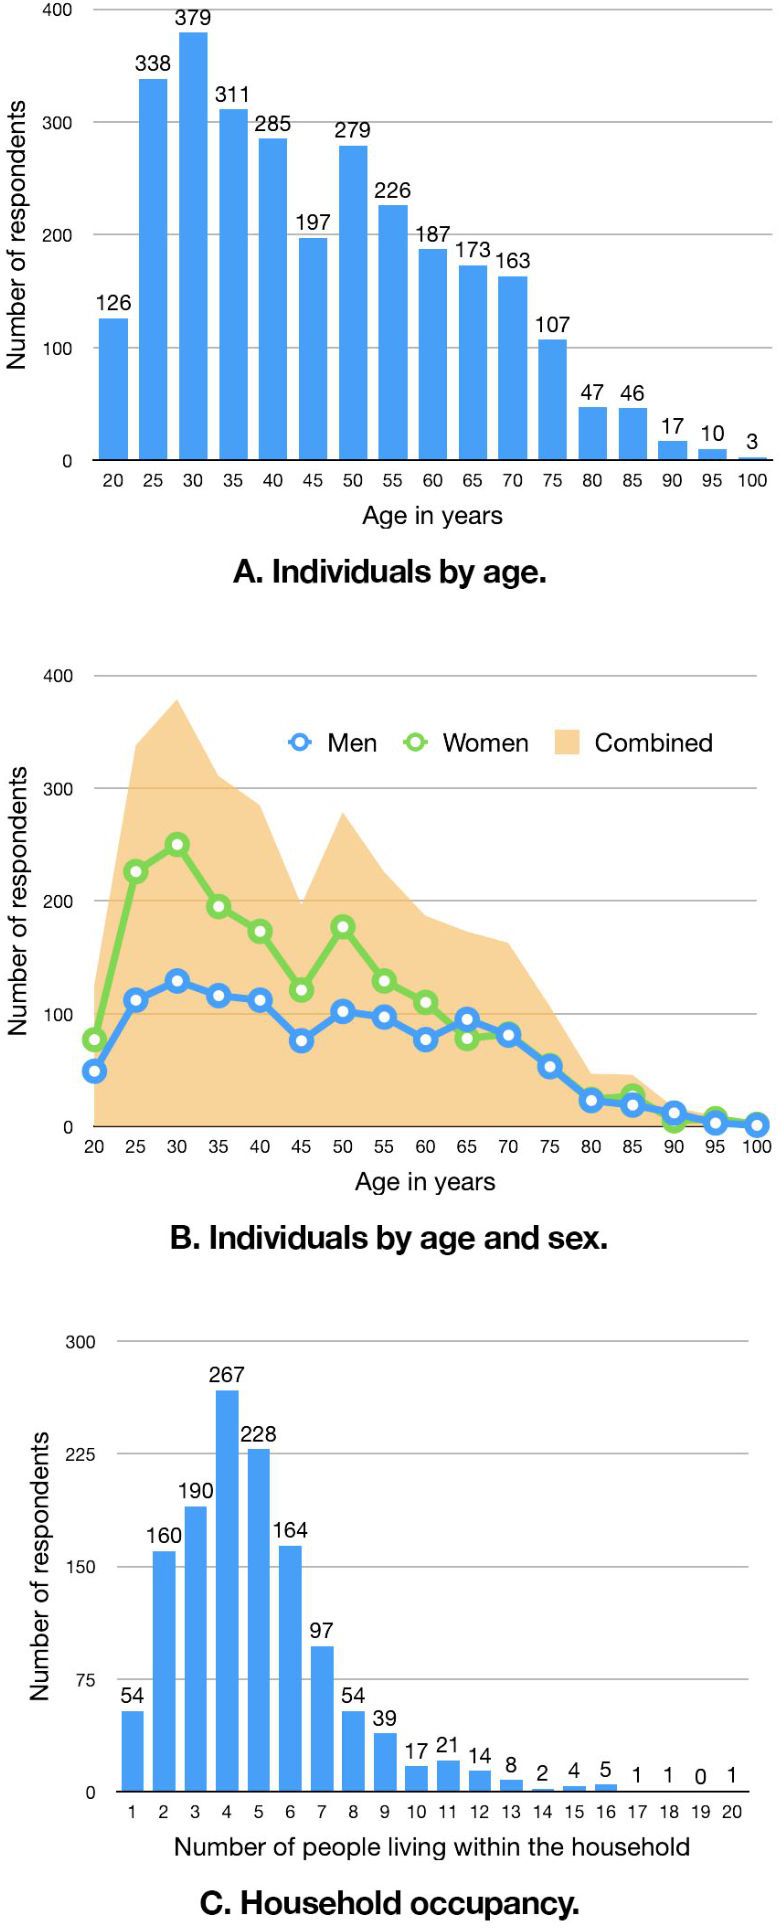
The final sample size consisted of 1,346 households (yielding an overall household response rate of 82.6%, based on the registered count of N=1,630 households). 80.48% of the estimated cross-sectional population of individuals participated (n=2,903, N=3,607). The study population consisted of men and women between the ages of 18 and 100 (1,158 men, 1,745 women) (Table 1), with a mean age of 44. Refer to Figure 2, Plate A and B for age and gender data. The majority of the participants resided in 4-person households (n=267; Figure 2, Plate C).
_age__b)_age_and_sex__and_c)_household_occupancy.jpg)
Respiratory disease findings
Respiratory disease prevalence
23.4% of households reported at least one family member suffering from breathing difficulties. 10.3% of individuals reported having breathing difficulties. Of these individuals, 4.6% reported having seen a doctor for this condition. Of individuals who had seen a doctor, 47.3% reported currently taking medication for this condition.
Respiratory disease biomarker indicators
26.5% of individuals (men, 28.1%; women, 24.8%) showed signs of respiratory difficulty (i.e., 2 or more abnormal vital signs). 4.3% of these individuals showed significant difficulties (i.e., 3 abnormal vital signs). The prevalence of breathing difficulties proportionally increased with age, and the burden was evenly distributed between men and women. Respiratory difficulties were defined as two or more abnormal biomarker indicators; SpO2 ≤94%, HR ≥100, and RR ≥20.
Respiratory disease risk factors
Smoking
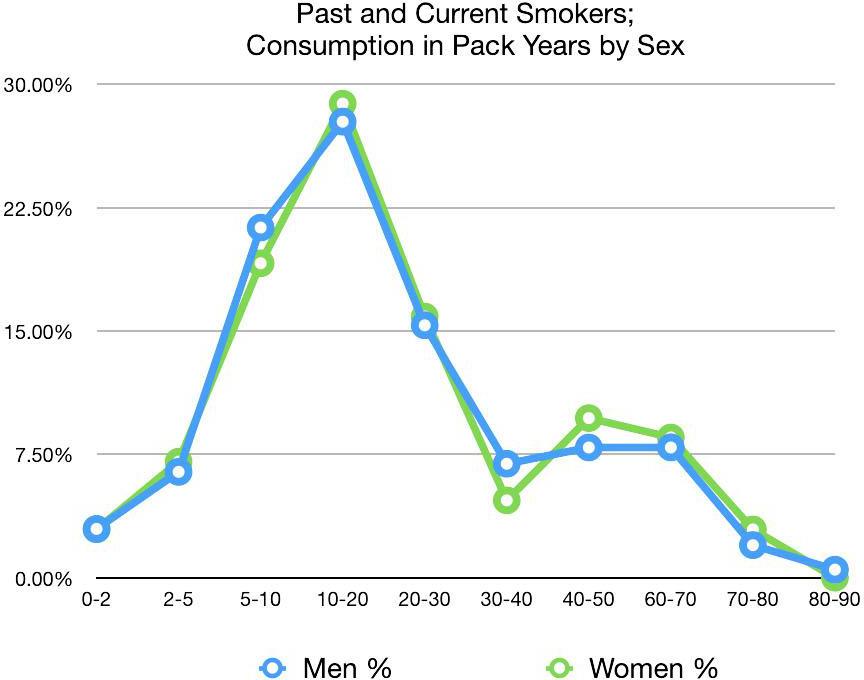
Current smokers accounted for 22.9% of the adult population. 35.3% of men reported currently smoking tobacco, while only 14.7% of women currently smoke. Past and current smokers reported an average of 23.84 pack-year history of consumption. Among current smokers, men and women appear to consume comparable amounts of tobacco for comparable timeframes (Figure 3).

Cooking ventilation and fuel
29.7% of households lack any ventilation for cooking smoke). 56.0% of households cook with firewood (Table 2).
Access to care
Breathing difficulties were listed as the primary reason for 5.0% of visits to the health post in the previous two weeks, 4.3% of hospital visits in the previous year, and 5.2% of hospitalizations (one or more nights) in the previous year. 12.7% of medications prescribed by a doctor were for breathing difficulties.
Cardiovascular disease findings
Hypertension prevalence
38.0% of households reported at least one family member with hypertension. 62.0% of households reported that they did not know if any family members had hypertension. 11.5% of individuals reported having high blood pressure. 19.8% of individuals did not know their blood pressure status. 56.1% of individuals reported having seen a doctor to have their blood pressure evaluated. Of these, 6.6% reported currently taking medication for hypertension.
Hypertension biomarker indicators
Hypertension was defined as systolic ≥140mmHg or diastolic ≥90mmHg.
26.3% of individuals showed signs of hypertension (men, 34.2%; women, 21.0%), with 12.4% of individuals having both elevated systolic and diastolic measurements. Of these individuals, 7.14% were currently taking antihypertensive medication(s).
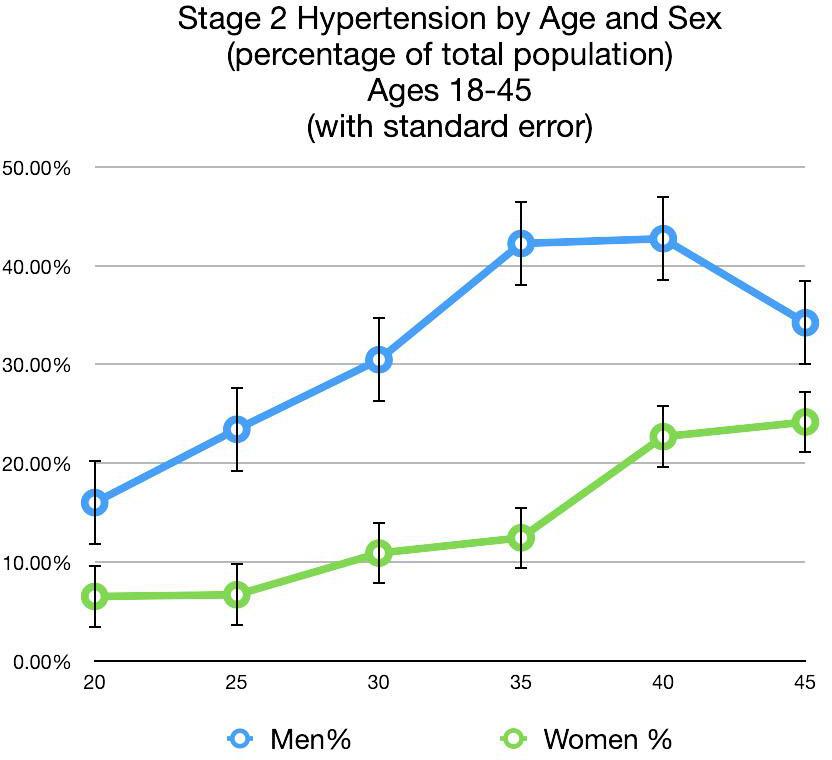
Comparing sex, men aged 18 to 45 experienced hypertension at higher rates (33.0%) than women in the same age group (13.4%) (Figure 4). Comparing ethnic groups, hypertension prevalence was as follows: Brahmin/Chhetri 19.8%, Janajati 27.0%, Dalit 35.4%, and 37.3% Madhesi. Hypertension prevalence amongst Janajati ethnic groups was as follows: Newar 26.3%, Tamang 25.5%, Gurung 40.6%, and Magar 30.0%.

Hypertension risk factors
Obesity
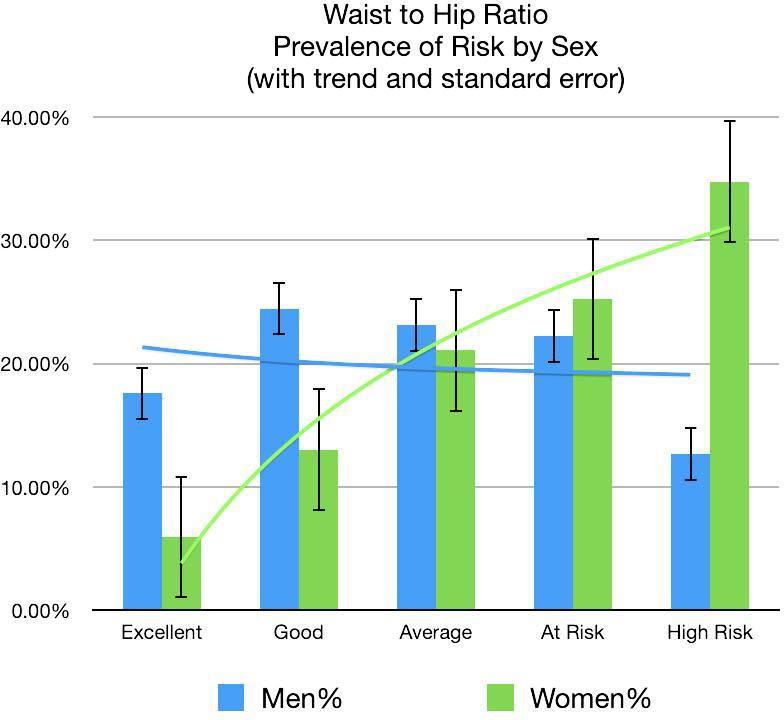
Obesity risk factors were determined by measuring waist-to-hip ratios (waist circumference/hip circumference). 22.2% of men were in an “AT RISK” (ratio =0.95-1.0) category, with an additional 12.7% in an “AT HIGH RISK” (ratio >1.0) category. 25.2% of women were in an “AT RISK” (ratio =0.85-0.90) category, with an additional 34.8% in an “AT HIGH RISK” (ratio >0.90) category. Evaluating individuals that were “AT RISK” and “AT HIGH RISK,” it is apparent that much of the increased risk for women occurs in young women aged 18 to 30. In this same age range, only 12.3% of men were at increased risk, compared to 22.8% of women. Women 18 to 30 years old made up 31.5% of the total female population surveyed (Figure 5).

Alcohol use
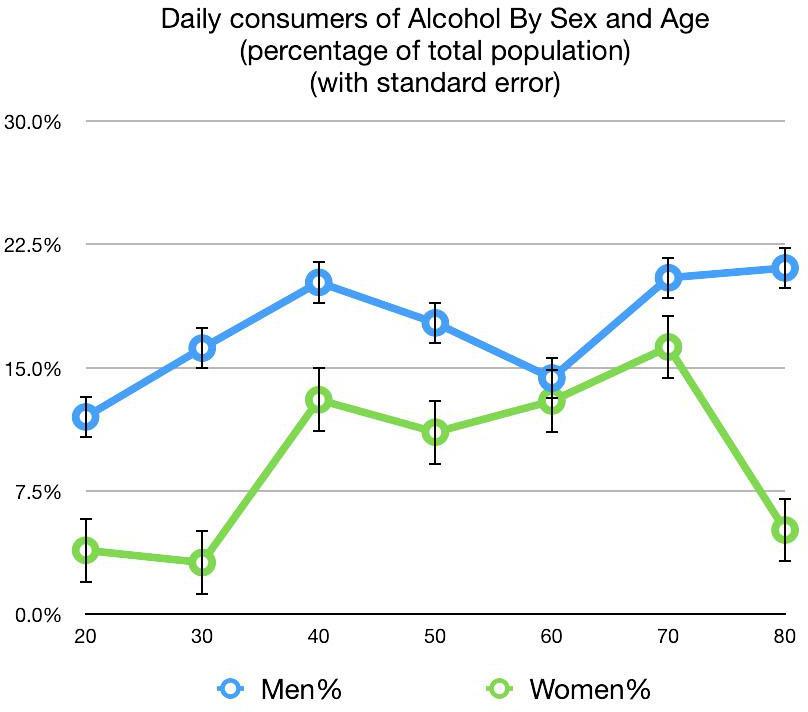
41.8% of all individuals surveyed reported currently drinking alcohol (men, 54.7%; women, 33.3%). Of individuals who reported drinking alcohol, 6.5% of men and 3.6% of women reported that alcohol had been a problem in their life. 28 individuals reported that their alcohol use was still a problem, and 16 individuals reported having been hospitalized for alcohol-related problems. 50.0% of all individuals who reported drinking alcohol consumed it on a daily basis, with 26.7% consuming several servings per day. Analyzing alcohol use by age and sex found that 17.6% of men aged 18 to 45 consume alcohol on a daily basis, compared to only 8.1% of women in the same age group (Figure 6).

Hypertension access to care
Blood pressure was listed as the primary reason for 14.8% of visits to the health post in the previous two weeks, 7.5% of hospital visits in the previous year, and 4.1% of hospitalizations (one or more nights) in the previous year. 14.3% of medications prescribed by a doctor were for hypertension.
Hyperglycemia findings
Hyperglycemia prevalence
13.3% of households reported at least one family member suffering from high blood sugar. 3.7% of individuals reported having high blood sugar. 50.0% of individuals did not know their blood sugar status. 19.1% of individuals reported having seen a doctor to evaluate their blood sugar levels. 10.6% of these individuals reported currently taking medication for hyperglycemia. 75.4% of individuals taking medication(s) for hyperglycemia reported having taken the medication(s) for more than one year. 46.4% had taken the medication(s) for more than three years.
Hyperglycemia biomarker indicators
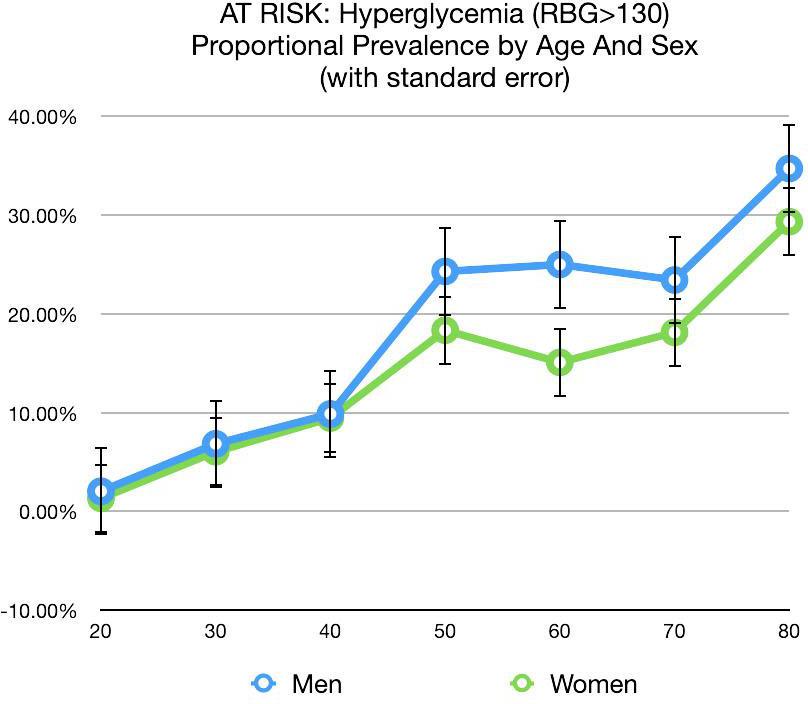
Hyperglycemia was categorized as “AT RISK” for individuals with a random blood glucose (rbg) >130mg/dl and as “HIGH RISK” for individuals with rbg >180mg/dl.
14.5% of individuals (men, 17.6%; women, 12.6%) show signs of “AT RISK” hyperglycemia. 2.8% of these individuals were at “HIGH RISK.” 25.5% of men aged 40 to 80 show signs of “AT RISK” hyperglycemia, compared to only 18.4% of women in the same age group (Figure 7).

Comparing hyperglycemia prevalence by ethnic group resulted in the following findings: Brahmin 16.9%, Chhetri 10.9%, Janajati 14.9%, Dalit 6.0%, and Madhesi 7.7%. Amongst Janajati ethnic groups, hyperglycemia prevalence was as follows: Tamang 12.3%, Newar 15.7%, Magar 16.0%, and Gurung 19.2%.
Hyperglycemia access to care
Blood sugar was listed as the primary reason for 5.4% of visits to the health post in the previous two weeks, 3.4% of hospital visits in the previous year, and 2.7% of hospitalizations (one or more nights) in the previous year. 10.4% of medications prescribed by a doctor were for hyperglycemia.
Chronic pain
Prevalence
57.0% of households reported at least one family member suffering from joint pain that interfered with work. Only 6.6% of individuals self-identified as having problems with chronic pain. Of individuals who reported that they can no longer work to support their families, joint pain interfering with work was given as the hindrance in 22.5% of individuals. 77.8% of individuals that received acupuncture at GHN’s clinic in Thaha in the last 12 months reported joint pain. 24.2% of individuals reporting problems with chronic pain identified that this condition interfered with their quality of life “Very Much.” Pain interfering with daily activities appears to be positively associated with age.
Access to care
Joint pain was the reason given for 19.0% of visits to the health post in the previous two weeks, 12.5% of individuals reporting hospitalization in the last year, 13.9% of hospital visits in the previous year, and 12.2% of hospitalizations (one or more nights) in the previous year. 10.4% of medications prescribed by a doctor were for joint pain.
Mental health
2.3% of households reported at least one family member suffering from mental illness. 5.8% of individuals reported having mental or memory difficulties. Only 4.8% of these individuals reported having seen a doctor for this condition. Additionally, only 3.6% reported taking any medications for this condition. 53.3% of individuals who identified mental or memory difficulties reported symptoms once to several times per day over the last 7 days.
12.3% of individuals reported having difficulties with anger or sadness. Only 1.7% of these individuals reported having seen a doctor for this condition. Only 0.3% reported taking any medications for this condition. 33.1% of individuals reporting difficulties with anger or sadness stated that it had been a problem in their life. 12.7% stated that it was currently a problem.
Socioeconomic indicators
Water and sanitation
98.7% of households receive water from a piped supply. 93.5% of households spend less than ten minutes per day fetching water. Only 20.0% of households utilize an adequate method of filtering or sterilizing their water supply. 95.6% of households use a flush toilet connected to a septic tank. 59.0% of households use burning to dispose of their garbage, while 43.9% use dumping. 74.7% of households separately manage decayable and non-decayable waste.
Housing and land
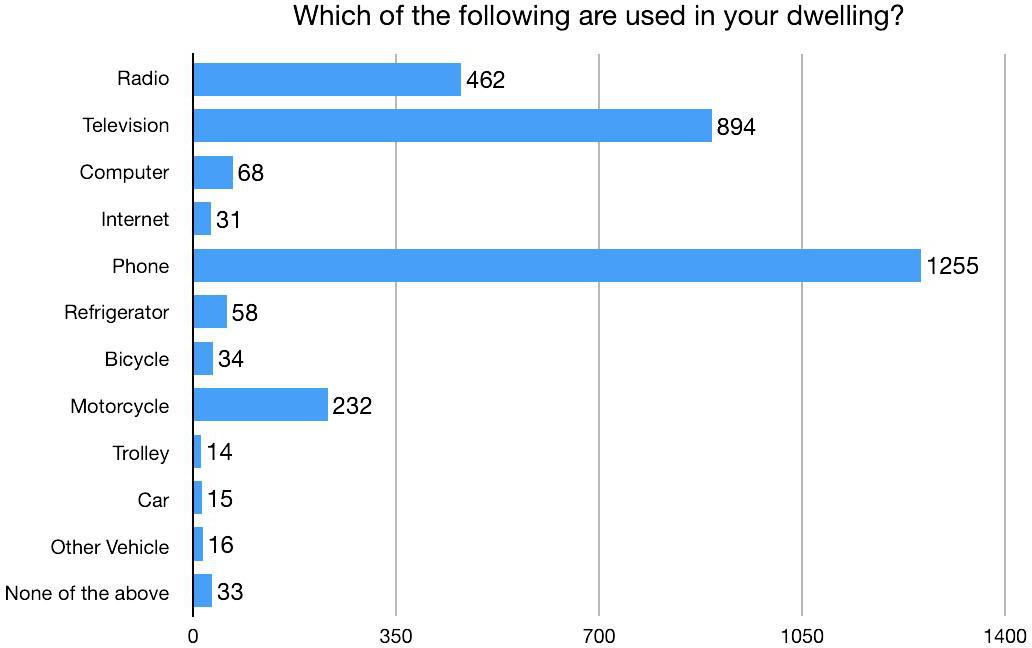
93.6% of households are personally owned. 66.3% of households own land. The mean land ownership for a household is 9.6 ropani (1.2 acres). 71.3% of households have mud foundations. 64.6% of households have outer walls constructed with mud. 60.6% of households use galvanized sheet metal for roofing material. 98.6% of households are electrified by a public grid for lighting. 94.4% of households have mobile phones, while only 4.4% utilize a refrigerator, 2.3% have internet access, and 1.1% have a car (Figure 8).

Livestock
82.2% of households have agricultural livestock. An average household with livestock owns 0.55 buffalos, 0.68 cows, 4.63 goats, and 2.12 chickens/ducks.
Food security
Overall, food insecurity was limited to approximately 2.5% of households.
DISCUSSION
Measuring morbidity and mortality are key considerations for estimating the burden of disease in populations. However, only focusing on morbidity and mortality effects provides an incomplete picture of the adverse impact of ill health on human welfare. In particular, the economic consequences of poor health can be substantial. Unexpected increases in health expenditure, reduced functional capacity, and lost income or productivity are often a primary risk factor for impoverishment.25 Poor levels of health may also adversely impact educational attainment and consequent levels of future income. At a societal level, poor population health is associated with lower savings rates, lower rates of return on capital, and lower levels of domestic and foreign investment. All of these factors can and do contribute to reductions in economic growth.26 By measuring these various adverse impacts, decision-makers can be provided with information to better understand the extent to which specific diseases or, more generally, depleted health statuses disrupt and reduce both economic production and consumption at the household or societal level.27
This baseline NCD census revealed 16% of households had at least one family member working out of the county. Over half of these workers had less than a 10th-grade education and had been abroad for more than two years. It is difficult to predict the long-term effects of this exported workforce on social, economic, and health outcomes of the community.
It was apparent that the inclusion of collecting biomarker data provided greater access to the community and increased the number of respondents. Villagers were eager to receive a “health check-up” in exchange for answering our long list of questions. Many previously undetected cases of respiratory distress, hypertension, and hyperglycemia were identified, and individuals were referred to local health facilities.
Biomarker data suggests that respiratory disease prevalence in Thaha could be as high as 4.3% overall (men, 5.3%; women, 3.6%), with an “AT RISK” prevalence as high as 26.0%. This is consistent with other studies showing the prevalence of COPD in Nepal at 4,810 per 100,000 population. This rate is higher than the global prevalence of 3,628 per 100,000 population, but lower than South Asia’s regional average of 5,319 per 100,000 population.28 Many sociobehavioral and environmental factors such as smoking, use of biomass cooking fuels, lack of proper ventilation in cooking areas, use of motorized vehicles, burning of garbage, and other sources of both indoor and outdoor air pollution (e.g., coal fired brick kilns)29 play a significant role in degrading air quality in Nepal. The burden of these risks disproportionately affects the elderly population.28
Biomarker data suggested an overall prevalence of Stage 2 Hypertension in Thaha to be as high as 26.3%. This would be consistent with a 26% worldwide prevalence.30 However, the 33.0% prevalence found amongst Thaha men aged 18 to 45 is concerning when compared to only 9.2% prevalence amongst men aged 18 to 39 in the United States.31 There is consistent evidence that alcohol consumption of ≥2 drinks per day increases blood pressure and the long-term risk of developing hypertension in both men and women.32 In one meta-analysis study of subjects consuming ≥1 alcoholic drinks per day, typically as liquor, there were corresponding 2.7 and 1.4 mm Hg increases in systolic and diastolic blood pressure.33 For alcohol consumption of >2 drinks per day, blood pressure levels rose by 5 mm Hg.34 Conversely, a pooled analysis by Xin et al.35 found that a 67% reduction in alcohol consumption among those consuming 3 to 6 drinks per day reduced systolic and diastolic blood pressures by 3.3 and 2.0 mm Hg, respectively. A 2010 study conducted in India found similar alcohol use prevalence risk factors in the surveyed rural population, of which nearly half (45%) were very frequent users (consuming alcohol daily or every alternate day). More than two-thirds of the users were in the 26 to 45 years age group.36 Obesity is also a major risk for essential hypertension and diabetes, causing cardiovascular and renal diseases through several mechanisms including hypertension, hyperglycemia, inflammation, dyslipidemia, and atherosclerosis.37 It has been shown that average systolic blood pressure and diastolic blood pressure increases significantly and linearly as body mass index (BMI) levels increase.38
The inclusion of chronic pain as an NCD should be considered. Pain is an enormous problem globally. Estimates suggest that 20% of adults suffer from chronic pain globally, and 10% are newly diagnosed with chronic pain each year. The cost of chronic pain to a health system and to a person’s overall quality of life is high. Despite this significant impact, chronic pain as a condition seems to have had little specific policy response. There does, however, appear to be sufficient evidence to make addressing chronic pain a high priority alongside other chronic diseases, particularly regarding health system cost.39–41
The study population’s variety of ethnic groups, education levels, and individual’s common use of the Nepali language may have contributed to some error and bias.
Future implications
This health census is scheduled to be expanded to include all wards of the Thaha municipality in early 2022. An additional 10,000 records with biomarker data are expected to be recorded. This data will be used to help allocate resources toward the development of lifestyle clinics in the region.
CONCLUSIONS
This study provides a feasible, reproducible and cost-efficient analysis demonstrating the establishment of a baseline evaluation for NCD prevalence. It utilizes demographic and biomarker data while also considering many socioeconomic and environmental influences within a community. It is applicable to governmental and non-governmental agencies addressing populations in rural areas and can be executed in relatively large survey areas. The data collected reveals many previously undetected health concerns in this community and can serve as an important tool for the allocation of resources. This baseline data will be utilized to guide the development of more efficacious healthcare programs, services, and facilities in the Thaha municipality, in addition to providing an adaptive assessment of their efficacy over time.
Acknowledgements
We would like to thank Nepal Health Research Council, Nepal Social Welfare Council and Makwanpur District Health Office for their valuable contributions to the research design and execution.
Funding
This research project is financially supported by Acupuncture Relief Project, Inc., a 501(c)3 non-profit organization (ID: 26-3335265). The content of the publication is the sole responsibility of authors (independent researchers) and does not necessarily reflect the position of organization.
Authorship contributions
Conceptualization of the study: AS, BG, DE. Study methodology: AS, BG, BM, DE. Data analysis: AS, BS. Study logistics: BG. Visualization of manuscript: AS. Original draft: JW. Review of the manuscript: AS, BM, JW, TL. Editing of the manuscript: AS, BM, JW, TL.
Competing interests
The authors completed the Unified Competing Interest form at www.icmje.org/coi_disclosure.pdf (available upon request from the corresponding author) and declare no conflicts of interest.
Correspondence to:
Acupuncture Relief Project, Vancouver, WA, USA, [email protected]