
While many countries around the world are going through second and third waves of the COVID-19 pandemic with substantial strain on their economies and health-care systems, the country of Saudi Arabia is witnessing a substantial decrease in the number of COVID-19 cases. The country reported its first COVID-19 case on 2 March 2020 and since then the country has recorded the highest number of cases in the Arab world with 362,601 infections and 6,214 deaths by the end of December 2020.1 However, the number of active cases has been decreasing steadily over the last 5 months. Since the end of September 2020, the daily cases have been constantly under 500 compared to peaks of 4900 reached in the mid-June 2020.1 While Saudi health authorities are carefully avoiding a premature declaration of victory, the statistics so far point to a promising future in combating the spread of the disease. A combination of factors may have been behind this success. The fighting against this pandemic is a multifaceted campaign involving many factors such as access to and quality of health care, public awareness, precautionary measures, curfews, and travel restrictions. Data suggests that countries which implemented early intervention measures may have managed to flatten their epidemic curves.2–4 In this regard, on the 15 March 2020, Saudi authorities had halted international travels following the first case reported in the country on 2 March 2020.5 The curbing of international travel was a crucial factor in the battle against COVID’s spread and may have avoided a catastrophic spread of the virus not only inside the country but also outside. Saudi Arabia is home to sacred sites of Islamic faith, and visitors from all over the world travel to perform two rituals called Hajj and Umrah. Hajj is performed only during a certain period annually and involves the gathering of around 3 million people for 5 days. Umrah can be performed at any time of the year with the country hosting 7.5 million international travelers in 2019 alone. On the 4 March 2020, Saudi Arabia suspended Umrah visits5,6 and took the drastic decision of limiting Hajj to the local population and residents.7,8 This step was praised by WHO and was a bold step in controlling the virus spread despite having a large economic impact as these religious gatherings generate around 12 billion dollars annually.2 In addition to international travel restrictions, Saudi Arabia imposed on 21 March 2020 a ban on all means of domestic travel within the country. The authorities also implemented strict measures for social distancing including the suspension of daily and weekly religious gatherings in mosques, the suspension of entertainment and sporting events and temporary closure of educational establishments and government establishments.5
In this paper we analyze if and how domestic travel restrictions have contributed to the decrease in COVID-19 cases in the country. One way of empirically examining this issue is to examine the trend in the daily reported cases of COVID-19 before and after the imposition of travel restrictions. For this purpose, we carry out a statistical analysis of the number of daily COVID-19 cases in the country as a whole and in selected cities. The analysis is done using Joinpoint Regression Program provided by the National Cancer Institute.9 This software was applied successfully in a number of public health framework10,11 and can be suitably used to explore whether the number of reported cases of a specific disease has changed after the implementation of an intervention.12
The cities (Riyadh, Mecca, Abha and Qatif) selected for this study were chosen carefully in order to include a number of parameters in the analysis. First, the cities belong to different geographical locations in the country. The cities also have different population sizes, and lastly some of the selected cities were subjected to longer travel restrictions than others. Besides the statistical analysis of the daily cases, we went further and fitted the time-dependent case fatality rate (CFR). This parameter, which represents the proportion of deaths due to the disease compared to total infected cases, can adequately explain the epidemiology of the outbreak of the disease. The inclusion of a statistical analysis of CFR allows to add an important layer of information to the epidemic dynamics since the CFR may have affected the general behavioral pattern of the population. It is possible that Covid-19 lethality has pushed a segment of population to decide not to travel during the pandemic even when no travel restrictions existed. The inclusion therefore of all these aforementioned parameters may shed lights on the effect of domestic travel restrictions on curbing the spread of the pandemic and provide guidelines to the authorities on future actions if needed.
METHODS
The daily data for COVID-19 cases were extracted from the Saudi ministry of health COVID-19 dashboard. The data corresponded to daily cases from 2 March 2020 when the first case was reported until the first of August 2020. This period was chosen since it covers the period of travel restrictions imposed by the authorities. In fact, the government had lifted all domestic travel restrictions by 21 June 2020 except for the city of Mecca. In addition to data relative to the whole country we also analyzed individual data for four cities: Riyadh, Mecca, Abha and Qatif. These cities have different population sizes and also correspond to different geographical locations in the country. Riyadh, located in the center, is the country capital with more than 7.6 million in population while Mecca with a population of 2 million and located in the western part is one of the two Islamic holy cities in the country. Abha, on the hand, with a population of 1.1 million is located in the southern part of the kingdom while Qatif with a population of 520,000 is located in the eastern region of the Kingdom and saw the occurrence of the first COVID-19 case. With the exception of Abha city, the other three cities have seen stricter travel restrictions than the rest of the country.5
The collected data was subjected to joinpoint analysis to look for the existence of statistically significant trends. Such trends are called “joinpoints”. In the present context, the application of the joinpoint regression analysis can answer the question of whether the imposition of travel restrictions either nationwide or in selected cities has resulted in the decrease in the reported cases of COVID-19. This can be checked if the day of introducing the intervention turned out to be a joinpoint. Given that the incubation period of the disease is on average 5-6 days and can be as long as 14 days, the effects of such interventions can be delayed and we therefore looked at the effects of such actions within a ten-days period. The joinpoint methodology is different from the conventional piecewise or segmented regression model since the identification of joinpoint(s) is estimated within the model and is not set arbitrarily. The minimum and the maximum number of joinpoint(s) are, however, set in advance but the final number of joinpoint(s) or the time point(s) when the trend changes is determined statistically. The program starts with the minimum number of joinpoints (0, which corresponds to the simple linear regression model) and checks if more joinpoints must be added to the model. The test of significance is based on a Monte Carlo Permutation method.13 The Bayesian Information Criterion (BIC) was used to identify the number of joinpoints in the model. The BIC method is comparatively less computationally intensive but it still took around 12 hours to generate each graph on an icore-7 PC.
The joinpoint program was also used to estimate the case fatality rate in the whole country. The cumulative number of confirmed cases was chosen as predictor variable while the cumulative number of deaths was selected as the response variable. The slope of the obtained fitted line(s) was considered to be an estimate of the CFR,14,15 and the confidence interval (CI, 95%) of CFR was also calculated. In order to minimize variations in the course of estimation of the CFR in the initial stage of outbreak when no death occurred, the date of the first reported death was used as the starting point of the analysis. The joinpoint analysis is also more suitable in computing CFR than simple linear or even nonlinear models used in similar studies.14,15 Instead of fitting the data for the whole time period using a user imposed model, the joinpoint analysis is able to identify different periods (i.e. joinpoints) where CFR undergoes statistically meaningful changes, and also provide linear fits for each period. This is important in our study since we are interested in monitoring the effect of time changes in CFR on public attitude during the pandemic.
RESULTS
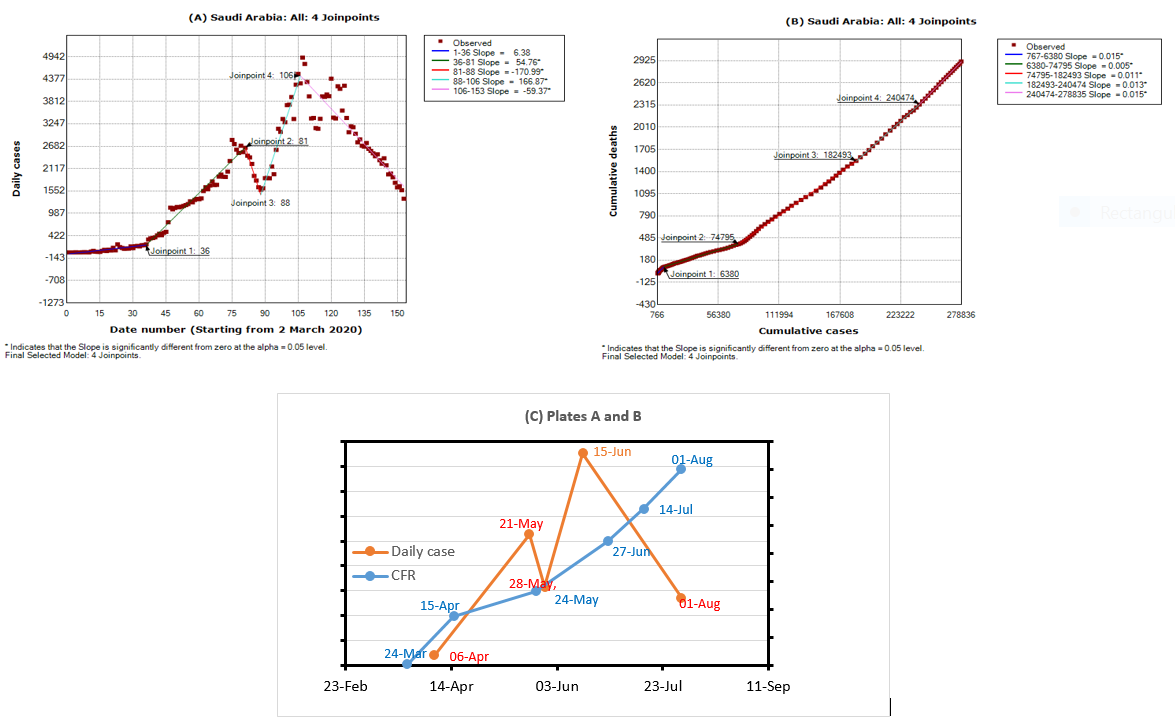
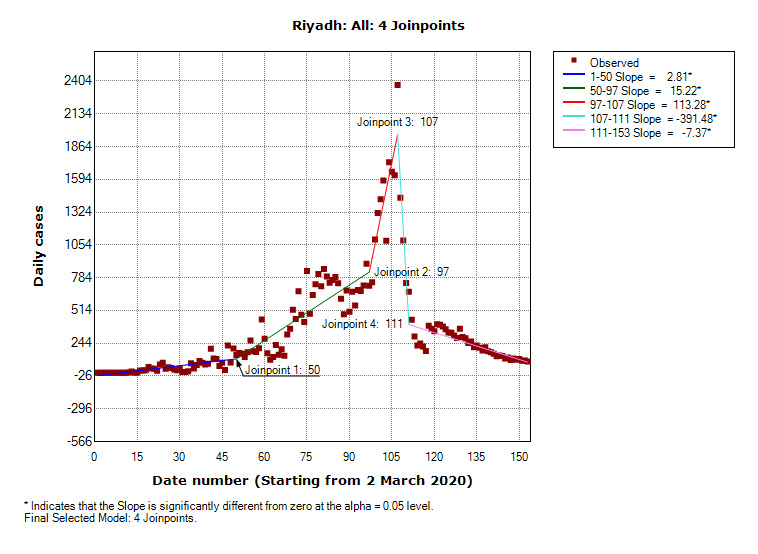
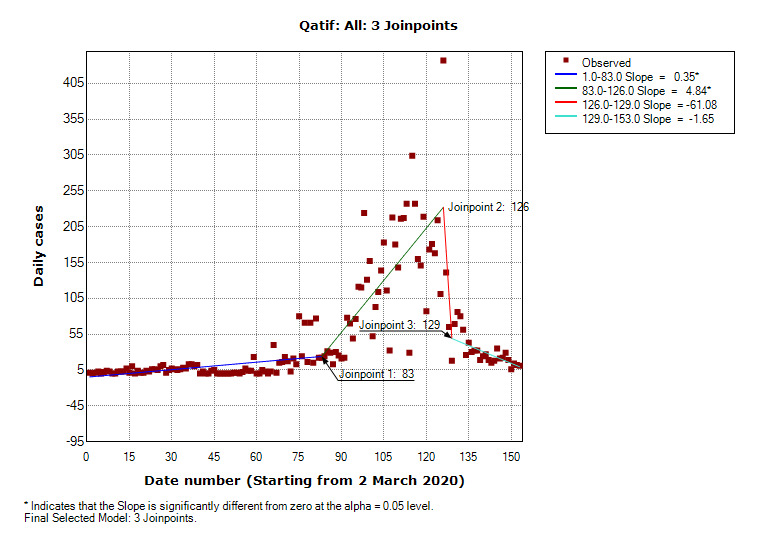
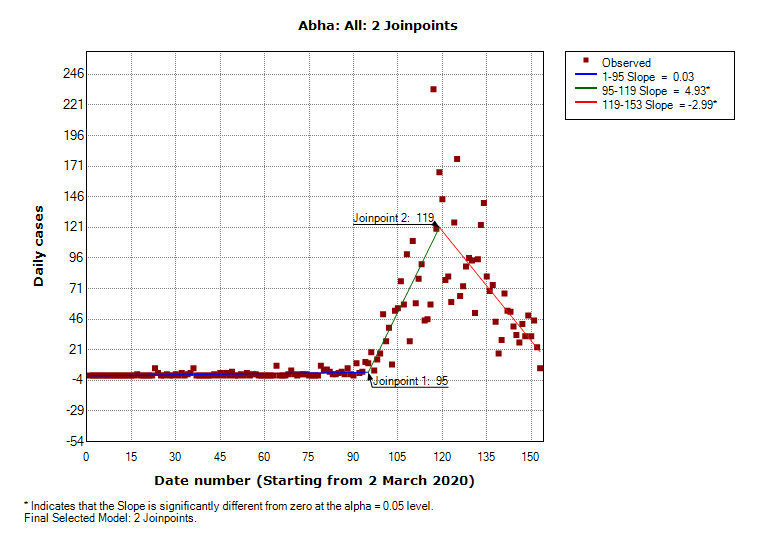
The results of joinpoint analysis applied to the country as a whole and to the cities of Riyadh, Mecca, Qatif and Abha are shown in Figures 1-5. For each region we plotted the number of daily cases versus time (Figure 1-5). The x-axis represents the date order starting from 2 March 2020 while the y-axis represents the COVID-19 daily cases. The dots points are the actual data and the connecting lines represent the regression lines attempted by the joinpoint software. The date numbers at which the joinpoints occur are shown directly in each figure. The legend on the right of each figure shows the time periods found by the program. Each time period is connected by a line for which the slope is indicated in the legend. However, not all the slopes are always statistically significant, as indicated by the star in the legend.


We also plotted the cumulative number of cases versus cumulative deaths (Figure 1, Panel B) for the whole country. The purpose is the extract the values of CFR. Again the found joinpoints are shown in the figure. The values of dates that correspond to these joinpoints can be found from the original files data (daily active cases). The slope indicated on the legend corresponds to the CFR. The results of joinpoint analysis for both daily and cumulative cases are suitably summarized in Table 1, together with the 95% confidence interval for the computed values of CFR. Moreover, in order to better analyze the time-dependent changes of CFR for the whole country, we have joined the two curves (Figure 1, Panel A and Panel B) in one plot (Figure 1, Panel C) to show the overlapping of the different joinpoints.
Figure 1 (Panel A) shows the joinpoint regression analysis for the whole country. The daily COVID-19 cases were found to change at the following four joinpoints: 36th day (6 April), 81st day (21 May), 88th (28 May) and 106th day (15 June). Figure 1 (Panel A) therefore divides the period under study (2 March 2020 through 1 August 2020) into five time segments and the trend is different in each period. During the first 36 days (2 March (day 1) through 6 April (day 36), the trend was positive and increased at an average rate of 6.4. However, this increase was not statistically significant and was discarded from further analysis. The next period consists of 46 days and started from 6 April (day 36) to 21 May (day 81). During this period, the daily cases increased at an average rate of 55 cases per day. This increase was found to be statistically significant. The third period lasted 8 days from 21 May (day 81) until 28 May (day 88) and saw a large decrease at a rate of 171. This sharp decrease was statistically significant. The fourth period, also statistically significant, lasted 19 days, from 28 May (day 88) to 15 June (day 106) and saw a sharp daily increase of reported cases at an average rate of 166. The final period lasted from 15 June (day 106) to the first of August 2020 (day 153) and saw a decrease in daily cases at a rate of 53. This decrease was also statistically significant.
Figure 1 (Panel B) shows the results of joinpoint regression analysis as applied to the cumulative number of cases and deaths. Four joinpoints were found: at 15 April 2020, 24 May 2020, 27 June 2020 and 14 July 2020. The time period can be broken therefore into five statistically different regions each one associated with a different CFR. The period between 24 March (date of first death) and 15 April had a CFR of 1.5%, then the CFR decreased to 0.5% for the period between 15 April and 24 May. It then increased to 1.1% between 24 May and 27 June, then to 1.3% between 27 June and 15 July and finally increased to 1.5% between 14 July and first of August.
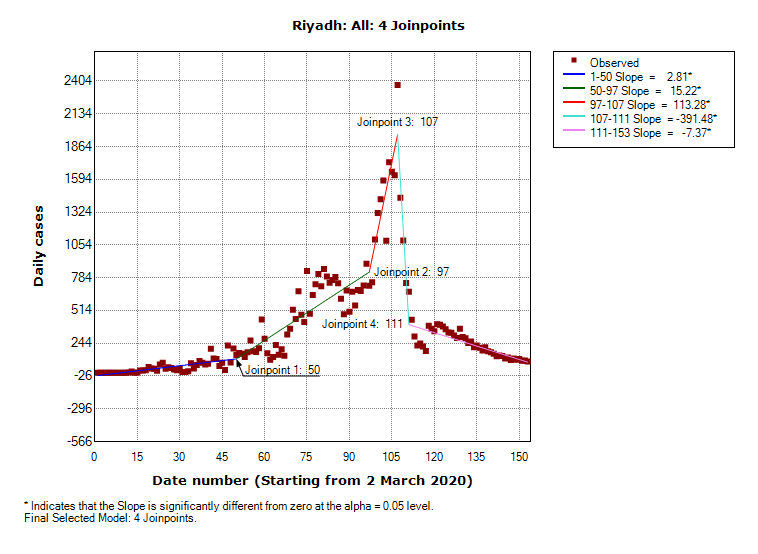
The results for the capital Riyadh are shown in Figure 2. Unlike the nationwide results, the joinpoint analysis revealed that the five periods were statistically significant. The first period corresponds to 2 March 2020 until 20 April 2020 and showed an increase in daily cases at an average rate of 2.8. The second period lasted from 20 April to 6 June and saw a larger daily increase at a rate of 15. The third period is a short one between 6 June and 16 June and saw a very large increase at rate of 113 while the fourth period is a much shorter one (16 June until 20 June) and saw a very large decrease at a rate of 391. The last period from 20 June to the first of August showed a moderate decrease at a rate of 7 cases per day.
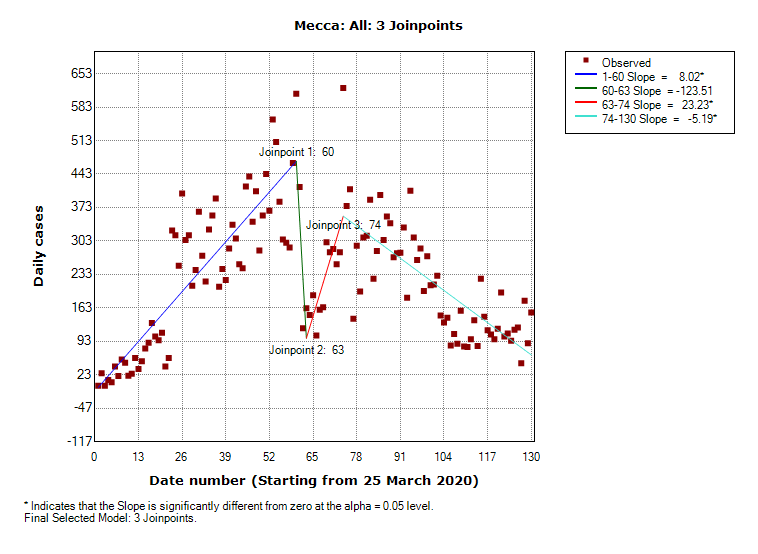
Figure 3 shows the results for the city of Mecca. Out of the five periods shown in the figure only three were found to be statistically significant. The first period between 27 March 2020 and 23 May 2020 saw a moderate increase of cases at a rate of 8. The second period, between 26 May and 6 June, saw an increase at a rate of 23 in daily cases and the third period between 6 June and the first of August saw a moderate decrease at a rate of 5 cases per day.
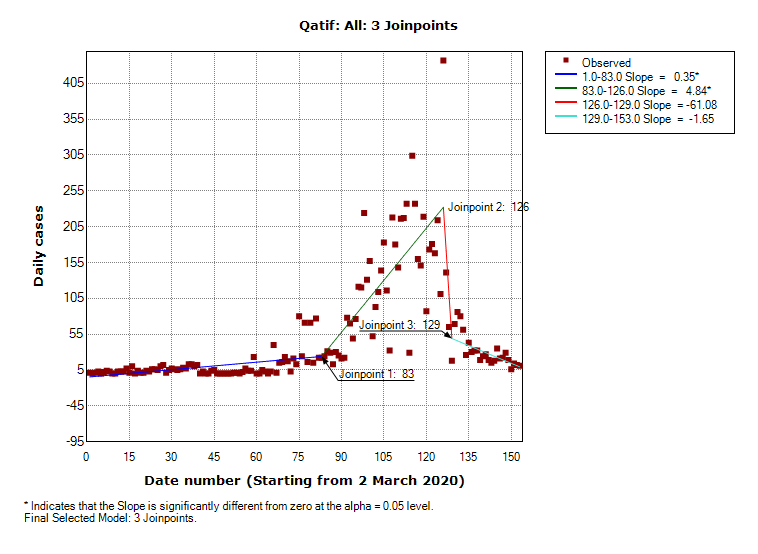
Figure 4 shows the results for the city of Qatif located in the eastern part of the country. Only two time periods were statistically significant. Between 2 March and 23 May (first joinpoint) the rate of increase was 0.35. Between 23 May and 5 July (second joinpoint) the rate of increase was 4.84. The trends in the rest of time periods were not statistically significant and were discarded from further analysis.
Finally, Figure 5 shows the results for the city of Abha located in the southern part of the country. Two joinpoints were found. The slope between 3 June (first joinpoint) and 27 June (second joinpoint) was 4.93 and that between 27 June and the first of August was -2.99.
DISCUSSION
Restrictions on domestic travelling were one of the measures implemented by the Saudi authorities to curb the spread of the pandemic. The analysis has revealed the existence of joinpoints indicating statistically significant changes in both the daily cases and the CFRs for the whole country and the selected cities. Next we examine whether these statistically significant periods coincide with any of the travel restrictions or other actions taken by the authorities. Table 2 summarizes all the measures imposed by the government starting from 4 March 2020 (day of suspension of Umrah pilgrimage) until 21 June 2020 when all restrictions were lifted except for international travels to and outside the country. Key date in the table are 15 March 2020 and 21 March 2020 which corresponded respectively to the ban on international travels and all types of domestic travels between the Kingdom cities. The date of 23 March 2020 is another important date as it was the day when a 12-hour nationwide curfew was imposed. Other key dates associated with each city are mentioned during the discussion.
For the whole country, the statistical analysis did not reveal any joinpoints around a ten-days period of the key aforementioned dates of 15 March 2020 and especially 21 March 2020 (day of ban of all domestic travel). On the other hand, the program revealed the existence of a joinpoint on 6 April 2020. This is the date when a 24-hour curfew was imposed in some cities (Riyadh, Tabuk and Dammam) (Table 2). However, the analysis showed a large increase (instead of an expected decrease) in COVID-19 cases between 6 April 2020 and 21 May 2020 (Figure 1, Panel A). Also, the large drop in cases in the short period between 21 May and 28 May could not be explained as these dates do not correspond to any special measures taken by the authorities. The program, on the other hand, found another joinpoint on 28 May. This date corresponds to the lifting of ban on travel between cities during periods of non-curfew and the partial lifting of ban on some commercial and industrial activities. The surge in the COVID-19 cases between 28 May and 15 June could be well explained by relaxation measures taken by authorities. However, the decrease in COVID-19 cases after 15 June does not correspond to any government intervention measure. In fact, the government had lifted almost all restrictions after 21 June 2020.
Overall, we conclude that the trends in COVID-19 data nationwide cannot be generally linked statistically to any travel restriction measures taken by the government except for the partial lifting of travel during 28 May which has contributed to the surge in COVID-19 cases.
For Riyadh, the only intervention measures that were specific to the city occurred on 26 March with the ban on entry and exit from the city and on 6 April with the imposition of a 24-hour curfew that lasted until 20 April and was lifted partially after that to accommodate the population during the fasting month of Ramadan. The joinpoint analysis has effectively found a joinpoint on 20 April and the increase in daily cases after this date can be traced back to the lifting of curfew during the month of Ramadan. On the other hand, the large jump in COVID-19 cases between 6 June and 16 June while statistically significant does not correspond to any special intervention measures taken for the city during this period. This is the same for the sudden large decrease in the number of cases between 16 June and 20 June and the moderate decrease that occurred after 20 June.
The holy city of Mecca on the other hand experienced the impact of early travel restrictions when Umrah (Islamic small pilgrimage) was suspended on 4 March 2020. Besides this date, key dates for the city included 26 March when a ban was imposed on entry and exit from the city and 2 April when a 24-hour curfew was imposed on the city and lasted partially until 21 June when Saudi authorities embarked on a plan to revive the Umrah pilgrimage.3 Looking at Table 1, the date of 27 March was found by the program as one of the joinpoints. This may explain why there was only a slight increase in COVID-19 cases in the city after this date compared to larger increase when curfew period was relaxed to accommodate the Ramadan fasting period.
Qatif was the city where the first COVID-19 case occurred and as such the city was subjected to early travel restrictions that started on 8 March and were not lifted until 29 April. The analysis, however, did not reveal any joinpoints around these dates. The only joinpoints were found around 24 May and 5 July.
Abha city, on the hand, did not witness any special domestic restrictions except the 21 March domestic travel restrictions imposed on the whole country. The analysis for the city did not find any joinpoints around 21 March . The increase seen after the joinpoint of 6 June coincides, on the other hand, with the lifting of restrictions during the Ramadan period.
Examining the public perception of the pandemic, the CFR for the whole country (Table 1 and Figure 1, Panel C) had a value of 1.5% for the initial period between the occurrence of the first death (24 March 2020) until 15 April 2020. This CFR value was smaller compared to values of 5.24% in Europe and 3.65% in North America reported in the same period.16 However, this value was still large compared to neighboring countries of UAE (0.51%) and Kuwait (0.59%). The CFR then decreases to 0.5% at the end of 24 May 2020 (second joinpoint). From this date onward the CFR value increased to 1.1, 1.3 and 1.5%. An increase or decrease in CFR can be due to a number of health care related factors but we are interested in this study in the way an increase in CFR affected the general behavioral pattern of the population since a segment of population may have decided out of fear of COVID-19 lethality not to travel even when the authorities did not impose travel restrictions. Figure 1 (Panel C) illustrates an interesting result regarding the perception of the population. After 28 May 2020 (the day the authorities lifted domestic travel restrictions) the CFR increased continuously. If travel restrictions were very important in controlling the disease and if people started travelling after 28 May 2020 discarding the high value of CFR (and the associated deaths) then this should have led to an increase in COVID-19 daily cases. If, on the other hand, people were afraid to travel because of large values of CFR then this should have decreased or at least stabilized the daily cases. Figure 1 (Panel C) shows that neither scenario happened. In fact, the daily COVID-19 cases increased after 28 May and then decreased. This means that other factors were more important in controlling the disease.
A final note is to be made about the CFR calculations. We have analyzed and shown only the CFR for the whole country. Individual values of CFR for each city were also computed but they did not yield any new results. The most likely reason is that the population attitude towards the lethality of the disease is influenced by total death in the country rather than fatalities reports in each city,
CONCLUSIONS
The paper analyzed time variations of COVID-19 cases in Saudi Arabia and attempted to explain the impact of domestic travel restrictions on the spread of the pandemic. Even though international travel restrictions were imposed early, COVID-19 cases continued to increase in the country for many months. We therefore focused on the effects of domestic travel restrictions and curfews. Overall, changes in data either nationwide or in the selected cities did not correspond very well with intervention measures regarding travel restrictions. Sudden and large changes in daily cases that occurred sometimes over short periods of time could be due to lack of sufficient testing of the population. However, the statistical analysis was successful in predicting the effects of partial lifting of domestic travel restrictions after 28 May 2020 and the partial lifting of curfew during the month of Ramadan.
The limitations of this study consist in COVID-19 data used everywhere for modeling patterns of the pandemic. Raw COVID-19 data is crude and uncertain at best, and as pointed out rightfully in,17 epidemiological data streams are not designed for modeling and hence assimilating information from such data is a major challenge that is particularly stark in novel disease outbreaks.
The study was, on the other hand, strengthened by a number of factors. Besides the use of the suitable joinpoint regression analysis software, the study was also strengthened by the introduction of a number of parameters to explain the epidemic spread pattern and determinants. These include the selection of cities with different population sizes, different geographical locations and which were subjected to travel restrictions of different severity. The study was also strengthened by the inclusion of public perception of the pandemic which was modeled by time-variations of case fatality rate.
We can conclude based on the inclusion on the aforementioned parameters that domestic travel restrictions played only a limited role in flattening the epidemic curve in the country. Factors that have played a larger role in curbing the spread of the disease may have been the heavy penalties applied on mask-wearing negligence and other measures that are still in place including school closures and social distancing in public gatherings and places of worship. This joins previous work18 that concluded that early detection, household quarantine, hand washing and social distancing are likely to be more effective than travel restrictions at mitigating the COVID-19 pandemic.
Ethics approval and consent to participate
The research is based on data which is open to public. Neither ethical approval of an institutional review board nor written informed consent was required
Availability of data and materials
The datasets used and/or analysed during the current study are available from the corresponding author on reasonable request.
Funding
The authors would like to thank the research center of college of engineering at King Saud university for its generous support.
Authorship contributions
SA: Initial study design, collection of data, results analysis and manuscript draft.
MA: Data analysis and review of the manuscript
AMA: Data analysis, manuscript draft and review of manuscript
All authors approved the final version of the manuscript.
MA is the guarantor.
Competing interests
All authors have completed the Unified Competing Interest form available at http://www.icmje.org/conflicts-of-interest/ in line with the Journal of Global Health editorial policy and declare no conflicts of interest.
Correspondence to:
Mohammad Asif, Ph.D
College of Engineering, King Saud University, Riyadh, Saudi Arabia