


The COVID-19 pandemic is producing a second wave and is straining the health-care systems of many countries. The Arabian Peninsula countries (Bahrain, Kuwait, Oman, Qatar, Saudi Arabia, the United Arab Emirates (UAE), and Yemen) are no exception. In fact, the smaller populated countries of this region have recorded some of the highest per-capita rates of COVID-19 cases in the world, placing substantial pressure on their health-care systems.1
Since the outbreak of the disease, scientific research has been active in many areas, including mechanisms of transmission, diagnosis, therapeutics, vaccine development, prevention measures, as well as social and financial impacts. However, public interest in the disease has received only limited attention in the literature.2,3 Because of the disease severity and the uncertainties engulfing it, communities everywhere are searching for information on the virus in any possible way. In this regard, countries with moderate to high internet penetrance rates have witnessed a surge in searches about almost all aspects of the disease, such as symptoms, infection mechanisms, protective measures, possible cures, and vaccines.2,3 In this paper, we examine the use of Google Trends4 (GT) to explore public awareness of the COVID-19 pandemic in the small countries of the Arabian Peninsula. GT is an online and free tracking tool of search volumes carried out in Google. GT helps the user to analyze the popularity of a searched keyword during a given time period and across a specific region. Since GT can freely access a large amount of population search data, it can be used to develop meaningful insights about population behavior and its health-related concerns. In this regard, GT has been used in connection with many health research areas, such as infectious diseases (Google Flu Trends5), mental health, and general population behavior.6–10 However, few studies were reported in the literature on the use of GT in connection with the COVID-19 pandemic.3,11–14 Hu et al.3 used GT to examine public awareness of COVID-19 in six countries, whereas Walker et al.11 used GT to investigate searches related to the loss of smell symptom associated with the COVID‐19 disease.
METHODS
Settings
The Arabian Peninsula consists of the countries of Bahrain, Kuwait, Oman, Qatar, Saudi Arabia, UAE, and Yemen. All these countries are similar in terms of culture. Yemen has a much smaller GDP per capita, lower internet penetrance rate, and the country is engulfed in a civil war. Therefore, it was excluded from this study. Saudi Arabia, with a population of approximately 34 million,15 is by far the largest country in the region, exceeding the other countries by many orders of magnitude (Table 1). To maintain an unbiased comparison, we also have excluded Saudi Arabia from our analysis. Therefore, we have limited our analysis to the five countries of Bahrain, Kuwait, Oman, Qatar, and UAE. All are relatively small countries with respect to population size. Regarding COVID-19 cases, these countries have reported high ratios (Table 1), with Bahrain announcing, as of December 30, 2020, a total of 55.5 cases per thousand people, followed by Qatar (52.1), Kuwait (36.2), UAE (24.0), and Oman (25.3). Moreover, with the exception of Oman, all other countries have very high internet penetrance rates of at least 94.9% (Table 1). The Google internet share in these countries is also similar and is no less than 96%16 (Table 1). Given these facts, GT data for these countries should typically be helpful in revealing major trends of public interest in the disease, its symptoms, and the inclination of the population to take protective measures.
Data collection
GT collects data from all Google searches, with the popularity of a keyword determined by the relative search volume (RSV). When a search term is selected, a “search category” is chosen that can incorporate all variations of the search term as well as different languages. This approach is important because Arabic is the dominant language in these countries, along with other languages spoken by a large number of expatriates.
Because internet searches associated with COVID-19 can cover a wide range of topics, we have limited our investigation to three search areas: (a) searches for “Coronavirus”, (b) searches for the disease symptoms, and (c) searches for protective measures to control the spread of the disease.
The COVID-19 symptoms were taken from the World Health Organization (WHO) website.17 The list contains the most common symptoms (fever, cough, and tiredness), less common symptoms (aches and pains, sore throat, diarrhea, conjunctivitis, headache, and loss of smell), and serious symptoms (shortness of breath and chest pain). The list of preventive measures consists of social distancing, quarantine, hand sanitizers, and masks.
Data analysis
For each search keyword, the RSV data from GT were extracted for the period extending from January 1, 2020 to August 8, 2020. The reason we restricted the analysis to this period is that the interest in Coronavirus faded after this period, as will be discussed later. Data were subjected to statistical analysis using the Joinpoint regression program18 to look for the existence of statistically significant trends. Such trends are referred to as “joinpoints”—a zero joinpoint would indicate no change in trend. The joinpoint methodology is better suited here to uncover statistically significant changes in a trend, which other methods (e.g., autoregressive integrated moving average analysis) may miss.19
Joinpoint analysis has been used successfully with and without GT data in a number of health studies.8,20 The joinpoint analysis allowed us to exclude non-meaningful search items (i.e., those that did not display any significant changes in trend). The average RSV values, on the other hand, allowed to rank the search items by order of importance.
RESULTS
Coronavirus search interest
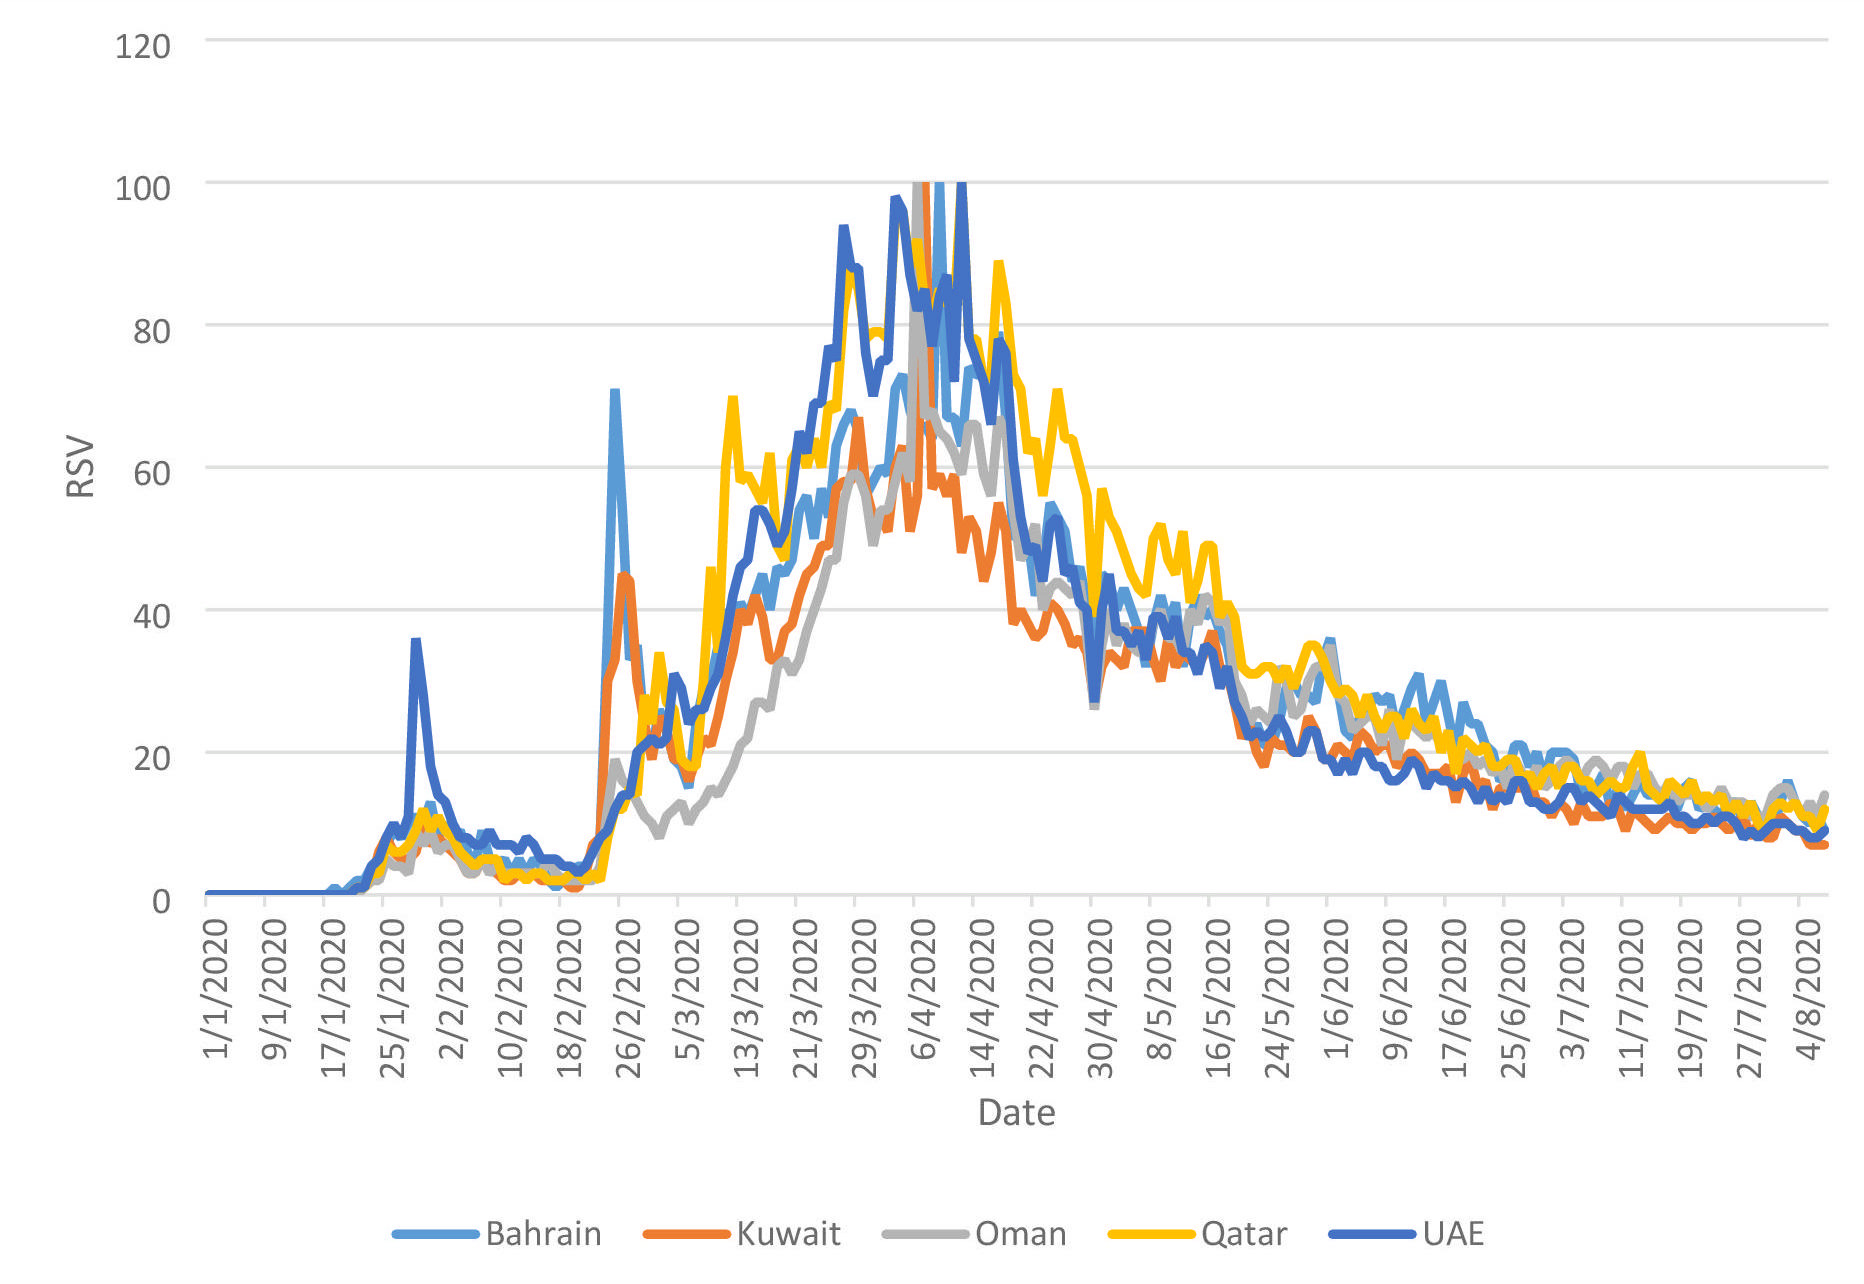
The RSV results for the “Coronavirus” search in the five countries for the selected time period are shown in Figure 1. The RSV for each country is calculated by dividing the sampled search data points by the total number of searches done in that specific country and during the given time period, after which the resulting values are scaled from 0 to 100. All countries (Figure 1) show more or less a similar trend that consists of an increase in RSV, reaching the peak of 100 and then fading out. Table 2 summarizes the quantitative results for the “Coronavirus” search. In terms of relative search volume, it can be seen that the average value of RSV for Qatar is 30.1 and is larger than Bahrain (26.7), UAE (26.5), Oman (22.8), and Kuwait (21.6). The data were then fed into the Joinpoint regression program for analysis. The program began with the minimum number of joinpoints (0, which corresponds to the simple linear regression model) and checked whether more joinpoints must be added to the model. The results of the data fitting are shown in the joinpoint graph (Figure 2) for UAE (for the sake of space limitations, the figures for other countries are not included because they have a similar trend). The y-axis of the figure shows the RSV data (labeled by the program as “proportion”), whereas the x-axis represents the date order, starting from January 1, 2020. The results of the figure (legend on the right) indicate that the program managed to find three joinpoints and Figure 2, therefore, divided the period under study into four time segments that are statistically significant.

The existence of three joinpoints for each country indicates a real change in trend in the RSV data. Table 2 shows the locations (in days) of the joinpoints for each country. Some features of these points are analyzed in a later section.
Disease symptoms
Table 3 shows the RSV results for the disease symptoms. It can be seen that for all these countries, no joinpoints (and, therefore, no change in trend) were found for fatigue, diarrhea, conjunctivitis, and myalgia symptoms. Apparently, these four symptoms did not receive the attention of Google users in any of the studied countries. Fever and cough, on the other hand, showed a meaningful trend (2 joinpoints) in all the studied countries, except Oman. Sore throat was meaningful only in Kuwait, Qatar, and UAE. Searches for the headache symptom were sought only in UAE, loss of smell was meaningful only in Kuwait and UAE (2 joinpoints), shortness of breath was searched for in Kuwait, Qatar, and UAE, and finally, searches for chest pain were meaningful only in UAE. Figure 3 shows an example of RSV plots over the studied period for fever in all countries except Oman, where searching for fever was not statistically significant.

Protective measures
Table 4 shows that apart from Bahrain, all other countries experienced a meaningful search for all the four selected prevention measures (social distancing, quarantine, hand sanitizers, and masks). For Bahrain, the users were interested only in the quarantine (average RSV of 11.1). For Kuwait, the order of importance was as follows: quarantine (14.5), masks (12.8), hand sanitizers (9.0), and social distancing (7.6). For Oman, the order of importance was: masks (28.0), quarantine (17.2), social distancing (7.4), and hand sanitizers (7.2). For Qatar, the order of importance was similar to Oman: masks (21.3), quarantine (19.6), social distancing (11.8), and hand sanitizers (7.1). Finally, for UAE, the order of importance was: quarantine (23.3), social distancing (17.5), hand sanitizers (14.3), and masks (11.8).
DISCUSSION
The significant media coverage surrounding the COVID-19 pandemic has certainly generated substantial web search activities in Google. This phenomenon explains why Google users in the studied countries began searching for Coronavirus around the time their countries reported their first cases. In this regard, the first COVID-19 cases in the five countries were reported around the same time: Bahrain (February 21), Kuwait (February 24), Oman (February 24), Qatar (February 29), and UAE (February 29).1 Table 2, on the other hand, shows that the first joinpoint was observed respectively on February 18 for Bahrain and Kuwait, March 9 for Oman, February 22 for Qatar, and February 27 for UAE. These dates are close to the days of the first reported cases, after which there was a sharp increase in search volume (Figure 1). Hence, there was a strong, positive relationship between public interest and the growing disease burden faced by these countries. The second joinpoint (Figure 2 and Table 2) corresponds, on the other hand, to the peak of search volumes. It can be seen (Table 2) that search interest in all the countries reached a peak around the same time: April 4 to April 9. After the peak, a fall in trend of the extracted RSV was seen (e.g., Figure 1) despite the increase with time of COVID-19 cases in these countries. This finding is most likely due to the public becoming familiar with the pandemic and, therefore, searches for it were less frequent.
Public interest in COVID-19 symptoms in the selected countries was overall found to be associated with the following seven symptoms: fever, cough, sore throat, headache, shortness of breath, chest pain, and loss of smell. However, there are disparities between the studied countries. Bahrain reported interest only in two symptoms, Kuwait five, Qatar four, whereas UAE reported an interest in all the symptoms. Oman, on the other hand, did not report interest in any of the symptoms. There are three plausible explanations for these disparities: One has to do with the low internet penetrance rate in Oman (78%) compared to the other countries (>95%). The other reason is that the awareness of the disease was probably more widespread in social media in some countries; thus, interested people could have sought online health information using social media, such as Facebook or Twitter. In this regard, it was shown that social media has a major influence on health-seeking behavior in some countries of the Arabian Peninsula.21–23 These disparities may also be due to poor data collection by GT in Bahrain and Oman. Some extracted GT data for these two countries showed a high variability in RSV, producing alternating zero values (suggesting that no searches had been undertaken on that day). It could be that a significant proportion of users were executing useful searches during those dates; however, GT labeled low volume data relative to the peak as zero.
Moreover, in terms of the importance of the volume of searches, it can be seen from Table 3 that for Bahrain, searches for cough were more important (average RSV of 22.5) than fever (16.0). For Kuwait, the order of importance was the following: cough (average RSV of 40.2), fever (35.2), shortness of breath (33.0), sore throat (26.7), and loss of smell (7.1). For Qatar, the order of importance was: sore throat (30.3), cough (30.1), fever (27.5), and shortness of breath (18.3). Finally, for UAE, the order of importance was: headache (55.7), chest pain (44.1), shortness of breath (36.1), cough (34.8), fever (30.8), sore throat (29.6), and loss of smell (8.7). One reason why some symptoms were searched for more than others in any country could be due to the fact that they reflect the actual symptoms of COVID-19 in that specific country. However, because COVID-19 epidemiological data are not being released by the countries’ health authorities, it is not possible to conclude with certainty that the symptoms found through GT are the actual prevalent disease manifestations. However, the GT results are quite useful at this point and show at least the major areas of interest of Google users in COVID-19 symptoms in each country.
Figure 4 shows the variations of the RSV data for the loss of smell symptom for Kuwait and UAE. The search for this symptom was statistically significant (i.e., 2 joinpoints) only for these two countries, although fewer people searched for it as judged by the small average RSV values shown in Table 3. The first joinpoint for UAE was detected on April 14. It should be noted that the earliest date when loss of smell was added to the list of official symptoms of COVID-19 was on April 26 by the US CDC.23 Here, we see a situation where people in UAE searched on the internet for a COVID-19 symptom long before it was added officially to the list of symptoms, a result consistent with the conclusions reached in,11 who used GT to investigate searches on the loss of smell symptom associated with COVID-19 in eight countries.

With respect to prevention measures to control the spread of the disease, quarantine seemed to be searched for in all the studied countries. Moreover, the other protective measures (social distancing, masks, and hand sanitizers) were also searched for in all the countries except Bahrain. The most likely reason for this disparity is again poor data collection and management by GT because the extracted GT data for Bahrain showed alternating zero values. It may be possible that many users were executing useful searches, but GT ignored low volume data relative to the peak.
CONCLUSIONS
This study is the first of its kind to assess public awareness of COVID-19 in the five relatively small countries of the Arabian Peninsula. The results of this study are strengthened by the particularly high internet penetrance rate in four of the five studied countries, the high market share of Google, and the inclusion of search keywords in different languages. From this point of view, Google Trends was useful in uncovering the major areas of public interest associated with the COVID-19 pandemic. In this regard, GT was found to be strongly used in connection with COVID-19 in UAE, Kuwait, and Qatar. However, GT data were found to have limited use in Bahrain and especially in Oman. This difference may be due to the low internet penetrance rate in Oman, poor data collection where GT ignored small search volumes, and most likely the preference of people to use social media or other venues for their inquiries. The use of Google Trends as a public health tool could be substantially improved if its methods for data collection are publicly known. Data mining of the public is a growing concern. However, the data collected by GT is publicly available, completely anonymous, and user activity is only monitored when using the Google Search Engine and not their internet activity afterward. Finally, our methods could be applied to other regions, which may show different results. This strategy could offer insight into the behavior of the SARS-CoV-2 (severe acute respiratory syndrome coronavirus 2) with respect to different ethnicities and climates, ultimately allowing improved quality of information being released to the public. This approach will also allow accurate monitoring of the disease outbreak and public response.
Ethics approval and consent to participate
The research is based on data which is open to public. Neither ethical approval of an institutional review board nor written informed consent was required
Availability of data and materials
The datasets used and/or analysed during the current study are available from the corresponding author on reasonable request.
Funding
The authors extend their appreciation to the Deanship of Scientific Research at King Saud University for funding this work through research group no (RG-1441-188)
Authorship contributions
AA: Initial study design, collection of data, results analysis and manuscript draft.
MB: Data analysis and review of the manuscript
AMA: Data analysis and review of manuscript
All authors approved the final version of the manuscript.
AMA is the guarantor.
Competing interests
All authors have completed the Unified Competing Interest form available at http://www.icmje.org/conflicts-of-interest/ in line with the Journal of Global Health editorial policy and declare no conflicts of interest.
Correspondence to:
Abdelhamid Ajbar, Ph.D, College of engineering. King Saud University, Riyadh, Saudi Arabia; Email: [email protected]