

Since 1991, there have been reports from Dar es Salaam, Tanzania of occurrences of an unexplained syndrome comprised of optic neuropathy, hearing deficits, and peripheral neuropathy.1,2 These findings are striking, since it is very rare to see young people developing neuropathies like these for no clear reason. The optic neuropathy component of the syndrome has been studied the most1,3–5 and these studies have shown optic nerve atrophy associated with poor color vision. Hearing deficits have been noted in approximately 50% of the patients studied, and is typically described as sensorineural although some patients with conductive hearing loss have been described.6 The hearing deficits and peripheral neuropathy in these patients or their association with inflammatory markers or potential environmental exposures has not been well-characterized.
While most of the prior studies have focused on optic neuropathy, clinical experience in Tanzania indicates that some patients with the syndrome present primarily with hearing deficits with few or no visual symptoms initially. This highlights the importance of developing a clear set of diagnostic criteria for this syndrome, especially because individuals with the syndrome may come to medical attention through different routes [Ear Nose and Throat (ENT) clinic, eye clinic, neurology clinic], depending on which symptoms they experience first or which symptom is more disturbing.
Reports from other tropical countries have described a similar syndrome, which improved with vitamin B supplementation.7 To date, however, vitamin B deficiency has not been definitively related to the Tanzania syndrome with levels being low among both cases and controls in a previous investigation.7 Other possibilities that have been examined are subacute cyanide poisoning from cassava, Leber’s hereditary optic neuropathy, a low carbohydrate diet, or Human T-lymphotropic virus type 1 (HTLV-1 )infection.8,9 But to date, no definitive cause has been found and the syndrome remains an unexplained, endemic syndrome in Dar es Salaam.
One possible cause that has not been investigated is toxic metal exposure. A number of metals are known to affect the central nervous system,10,11 and in our previous study, we have found surprisingly high metal levels in a Nicaraguan mining community in particular among young individuals with neurologic symptoms and poor hearing.11 The national environmental officers in Dar es Salaam were consulted and this confirmed that environmental pollution from heavy metals is a problem in Tanzania. In particular, elevated metal concentrations have been found in vegetables grown along the Sinza and Msimbazi rivers in Dar es Salaam, and these rivers are known to be contaminated with heavy metals.12,13
The objective of the current study was to characterize the hearing deficits in patients referred for this pattern of symptoms and to determine if the presence of the syndrome could be associated with elevated inflammatory markers, heavy metal exposure, or other environmental factors.
METHODS
Study participants
The research protocol was approved by the Committee for the Protection of Human Subjects of Dartmouth College and the Research Ethics Committee of Muhimbili University for Health and Allied Sciences. All participants gave written informed consent or parental consent and minor assent. Patients were eligible to participate if they were less than 40 years old, had any symptoms (hearing loss, poor vision or peripheral neuropathy) consistent with the syndrome, and had no history of head injury, syphilis, or Human immunodeficiency virus (HIV).
Study procedures
Hearing assessment
The ears were examined otoscopically and cerumen was removed as needed. Hearing was assessed with a laptop-based hearing testing system described previously14 using a Grayson-Stadler Inc. (Grayson-Stadler, Inc., Eden Prairie, MN) in-ear probe initially and later in the study HAD-200 supra-aural headphones (Sennheiser electronic GmbH, Wennebostel, Germany). The system included: (a) questionnaires asking about self-reported hearing and exposure to noise, drugs and toxins, (b) threshold audiometry (either Békésy or a modified Hughson-Westlake protocol) to measure hearing sensitivity, (c) distortion product otoacoustic emission (DPOAE) testing to assess cochlear (outer hair cell) function, and (d) gap detection testing to assess central auditory processing abilities. Participants wore passive noise-attenuating earmuffs over the ears (David Clark Model 19 A, David Clark Company, Worcester, MA or 3M Peltor 97023 Junior Hearing Protector Earmuffs, St. Paul, MN). Sound levels in the ear canal were measured to establish that sound levels in the ear canal were quiet enough for testing.14 Data were stored in a relational database management system (Microsoft Access 2010, Microsoft, Redmond, WA).
A Madsen Otoflex 100 (GN Otometrics, Denmark) was used to perform tympanometry at 226Hz. Measurements of ear canal volume, static admittance, tympanometric peak pressure, tympanometric width, and tympanogram Type (A, As, Ad, B, C) were collected. The device classified the tympanogram from the location (pressure and static admittance) of the peak. The Type A pressure limits were -100 to +50 daPa, and the static admittance limits were 0.3-1.7 mmho. Tympanograms with static admittance levels less than 0.3 mmho with a discernable peak were classified as Type As, those with levels less than 0.3 mmho with no discernable peak were classified as Type B. Those with static admittance levels greater than 1.7 mmho were classified as Type Ad. Tympanograms with pressures outside the Type A range, but within the static admittance limits, were classified as Type C. Those with Type B or Type C tympanograms were sent for evaluation and treatment. A subset of patients also had acoustic reflex testing with this device.
Kiswahili-based video questionnaires gathered data on the participants self-reported hearing ability (hearing status questionnaire) and general health (health history questionnaire). The questions covered noise exposure, tinnitus, ear drainage, ear infections, chemical exposure, and balance problems. Air conduction pure-tone audiometric thresholds were measured at frequencies of 500, 1000, 2000, and 4000 Hz using a Békésy-like tracking procedure described previously.14 Pulsed tones with a duration of 250 msec, a rise and fall time of 20 msec, and an interstimulus interval of 500 msec were used. When the button was pressed the tone decreased in 4-dB steps until the first reversal, then 2-dB steps were used. Upon releasing the button, the tones increased in 2-dB steps. A total of six good reversals were counted and averaged. The total time for testing was less than five min/ear. Three individuals noted significant hearing difficulties on the questionnaire and could not complete the audiometry successfully. As the presence of hearing loss was the primary outcome variable (not the degree of hearing sensitivity), for these three individuals, their thresholds were set to the mean of the referred case group.
For DPOAEs, emissions were collected at f2 values of 1500, 1700, 2000, 2200, 3000, 3200, 4000, 4200, 6000, 6200, 7800, and 8000 Hz using an f2/f1 ratio of 1.2 and L1/L2 values of 65/55. Data were also collected using L1/L2 values of 70/70, but these were not used due to a higher rate of abnormally high values due to ear canal resonances. The f2-f1 frequency pair were delivered for a minimum of four seconds. After four seconds, if the DPOAE distortion product level (DP) and averaged noise floor level (NF) difference was less than 10 dB, the frequency pair continued to be presented until either a DP-NF value of 10 was reached or 10 seconds had elapsed. The operators instructed the participants not to swallow during DPOAE testing, and to remove extraneous noise an adaptive noise-rejection algorithm was used. An in-ear calibration was not used (i.e., the speaker output was not adjusted in the ear canal). In some subjects, likely due to resonances in the ear canal, unrealistically high values for DPOAEs and noise floors were returned. These values were discarded for the data analysis. The level of harmonic distortion for each system was determined using a Brüel and Kjær Type 4157 Ear Simulator/Artificial Ear (Bruel and Kjaer Type, Nærum, Denmark).
Because consistent DPOAE probe placement is important for achieving consistent results over time, a “position check” (frequency sweep) was presented in the ear canal prior to DPOAE testing. Three position checks (500-5000Hz) at 65 dB SPL were averaged, smoothed, and displayed to the operator. A measured level below 20 dB SPL at 500 Hz was used to indicate a bad probe seal. In the case of a bad seal the probe was reseated and the chirps were repeated.
To determine an individual’s gap detection threshold, the participant was trained to press a button when a short gap in noise was heard. The gaps were placed randomly in the middle portion of 4.5 seconds of white noise delivered at 65 dB SPL. The details of the gap detection test have been published previously.14 The best gap detection threshold from the two ears calculated from the three lowest successfully detected gaps was used in the analysis.
Auditory Brainstem Response (ABR) testing was performed using a GSI AUDIOScreener (Grason-Stadler, Inc(GSI), Eden Prairie, MN). The primary stimulus was a broadband click presented at 32/second at 60 dB nHL. The neural response was detected using skin electrodes placed on each mastoid process and the forehead. The measured voltage was filtered from 30-1500 Hz. There was a high rate of low-quality tracings from this device and later in the project a subset of participants was studied using a SmartEP ABR system (Intelligent Hearing Systems, Miami, FL). An experienced audiologist (CCR) reviewed all the available ABR, audiometry, DPOAE, and acoustic reflex results and made a determination of whether the evidence for auditory neuropathy was low, medium, or high based on these data. For the case determinations (described below), however, just the pure-tone average and DPOAEs were used to classify patients because of the high rate of uninterpretable ABRs and limited number of acoustic reflex tests.
Normative data for DPOAEs
There are no norms for DPOAEs in Tanzania. These norms are important to assess whether a given individual has abnormal DPOAE amplitudes. For a study of hearing parameters in patients with HIV, we had enrolled a HIV- control group.14,15 These individuals had been tested with the same equipment and protocols as were used in the current study. Normal hearing subjects from this cohort (four frequency pure tone average ≤25 dB HL) were used to calculate norms for DPOAE values. The group included 94 individuals (48 women, 46 men) with an average age of 22.5 years (range 12-43). To calculate the norms, the DPOAE levels from 2, 3, and 4 kHz from both ears were averaged.
Vision assessment
Vision was assessed using a Snellen chart both with and without a pinhole. Color vision was assessed using the Farnsworth D-15 hue test.16 Patients had anterior pupillary defect testing using the swinging light test. Overall visual functioning was evaluated using a Kiswahili translation of the National Eye Institute Visual Functioning Questionnaire - 25 (VFQ-25).17
Peripheral neuropathy assessment
Peripheral nervous system complaints were assessed using the Michigan Neuropathy Screening Instrument (MNSI).18 The MNSI examination involves 1) inspection of the feet for deformities, dry skin, nail abnormalities, callous or infection, and for ulcerations, 2) semi-quantitative assessment of vibration sensation at the dorsum of the great toe, 3) grading of ankle reflexes and 4) monofilament testing.
Blood sampling
A peripheral venous blood sample was taken for determination of C-reactive protein (CRP), and erythrocyte sedimentation rate (ESR). The patient was also tested to insure they had no evidence for syphilis or HIV infection.
Toenail samples
Toenail samples were obtained with new nail clippers and stored in metal-free envelopes. Nail samples were analyzed for metal concentrations using inductively coupled plasma mass spectrometry (ICP-MS) at the Trace Elements Analysis Laboratory at Dartmouth College. Prior to ICP-MS, nail clippings were washed in an ultrasonic bath with acetone, 1% Triton X-100 solution, and deionized water. This washing procedure removes external contamination (nail polish, dirt, etc.) without extracting metals from within the nails. After nail clipping washing, the nail clippings were digested using a CEM MARS Express system. An Agilent 7700x ICP-MS in both collision cell and standard (no cell gas) mode was used to determine metal concentrations in the digested samples. Blank DBS samples were analyzed to subtract background metal levels. Quality control procedures were based on United States Environmental Protection Agency (U.S EPA) recommendations as outlined in EPA6020. The concentrations of arsenic (As), mercury (Hg), lead (Pb), aluminum (Al), manganese (Mn), vanadium (V), chromium (Cr), iron (Fe), cobalt (Co), nickel (Ni), copper (Cu), zinc (Zn), selenium (Se), molybdenum (Mo), cadmium (Cd), tin (Sn), and uranium (U) were determined from the samples.
Questionnaire
The interview-administered questionnaire focused on environmental exposures that could possibly relate to the symptoms. The questionnaire asked about whether the patient attended boarding school (some boarding schools provide inadequate nutrition), ate uncooked cassava (which can contain cyanide), burned trash, fumigated their homes, or used hair chemicals. The questionnaire also asked if any family members had similar symptoms.
Case definitions
No formal criteria exist to diagnose this syndrome. Some of the individuals referred had only one major sign of a neuropathy. Only eight individuals had evidence for all three signs of the syndrome. Also, some individuals referred for hearing loss had sensorineural hearing loss and no evidence for an auditory neuropathy. Although ideally the ABR and acoustic reflex would be used to classify individuals as having an auditory neuropathy, there was a high rate of uninterpretable ABRs due to the use of a screening ABR and few acoustic reflex results in the cohort. An auditory neuropathy can reduce ABR amplitude and often it was difficult to determine if a poor ABR tracing was due to auditory neuropathy or to technical factors. In light of these limitations, the following criteria were developed to help define the cases. If an individual had a four frequency (500, 1000, 2000, 4000 Hz) pure-tone average of 25 dB or greater (World Health Organization (WHO) criteria for hearing loss) in either ear and the average of the DPOAEs at 2,3, and 4 kHz from the affected ear were within one standard deviation from the average DPOAEs for the normative group, this was defined as a potential auditory neuropathy (i.e., the patient had abnormal hearing in that ear with normal DPOAEs). Visual loss was defined as an abnormal Farnsworth test or visual acuity of 20/30 or worse that was not correctable with pinhole. A peripheral neuropathy was defined as a score of >4 on the Michigan Neuropathy Screening Instrument. A patient was defined as a case if they met any two of these criteria.
Statistical analysis
Analysis was done using matrix laboratory (MATLAB) 2020a (MathWorks, Natick MA). The results from the cases were compared to the controls using logistic regression analysis with “case” or “no case” as the response variable and the individual factors (ESR, CRP, metal levels, boarding school attendance, etc.) as the predictors. The characteristics of the groups were also compared using chi-square analysis and one-way analysis of variance (ANOVA) as appropriate. For the visual acuity data results from the Snellen chart were converted to LogMAR (log of the minimal angle of resolution) and statistical analysis was done using those values.19 The visual data were converted back to Snellen values for presentation in the tables. The correlation between metals was displayed using the “Correlation circles” function from Matlab Central.20 A p value of 0.05 or less was considered significant.
RESULTS
Table 1 shows the demographics of the overall cohort. Forty-seven individuals were referred as potentially having the syndrome, but only 29 met the criteria for a case. For those who did not meet criteria two had sensorineural hearing loss (i.e., poor hearing with poor DPOAEs), four met the hearing criteria but had no other symptoms, nine had only visual loss, and three met none of the criteria. For those who did meet the criteria, eight had signs or symptoms in three areas (28%), 13 met hearing and visual criteria (45%), seven met visual and peripheral neuropathy criteria (24%), and one met hearing and peripheral neuropathy criteria (3%). Five of the cases said that they had relatives with similar symptoms. As shown in Table 2, compared to the controls, the cases had significantly worse audiometry, vision, and MNSI scores. The gap detection thresholds were higher (worse) in the cases but did not reach statistical significance although a significant number of the cases could not complete the test. Fifteen individuals noted hearing loss as their first symptom, 12 noted visual loss first, and 2 noted peripheral numbness first. Figure 1 shows the order of symptoms that were reported. The average age the symptoms started was 17.2 years.

For technical reasons, it was difficult to get reliable ABR and acoustic reflex data on all individuals. An audiologist on the team reviewed the available data and made a determination whether the individual could potentially have an auditory neuropathy. None of the controls met the criteria for an auditory neuropathy, while 15 of the cases were classified as having an auditory neuropathy based on audiologist assessment of the available test results.
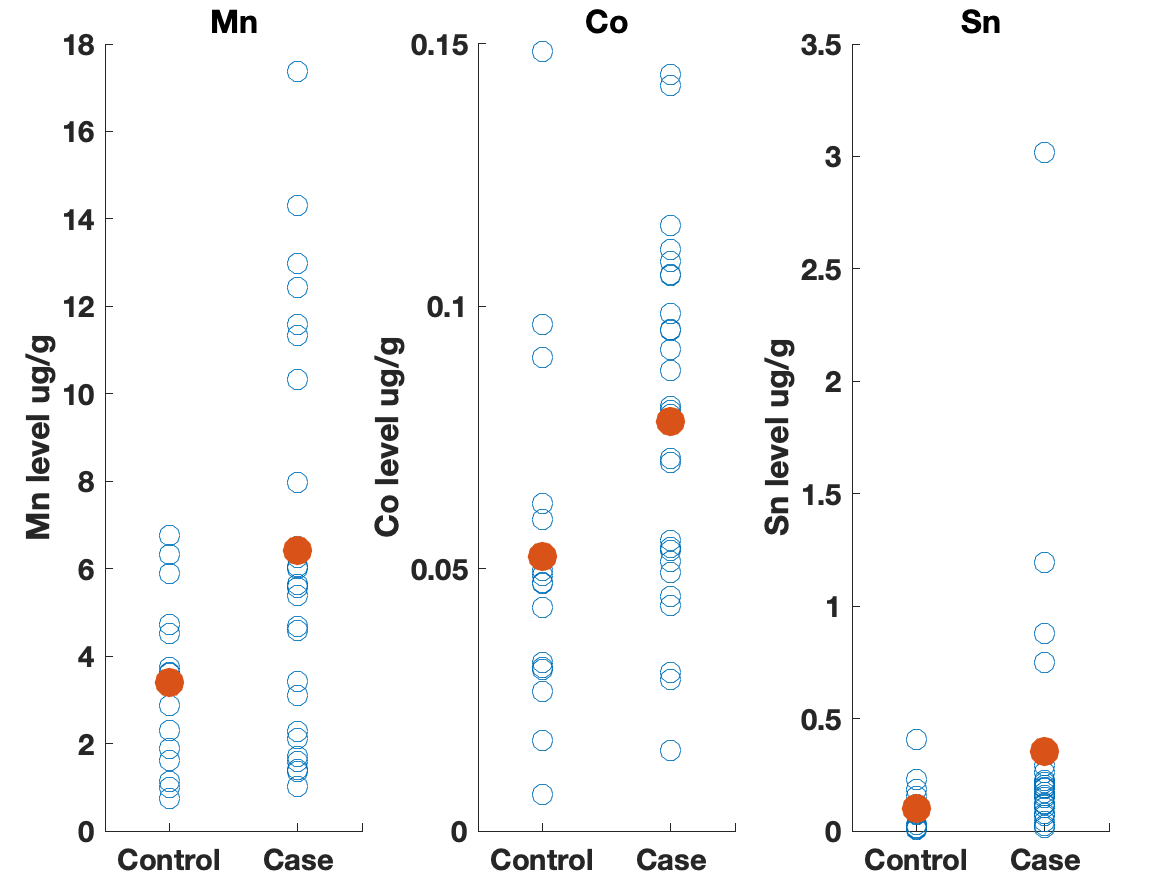
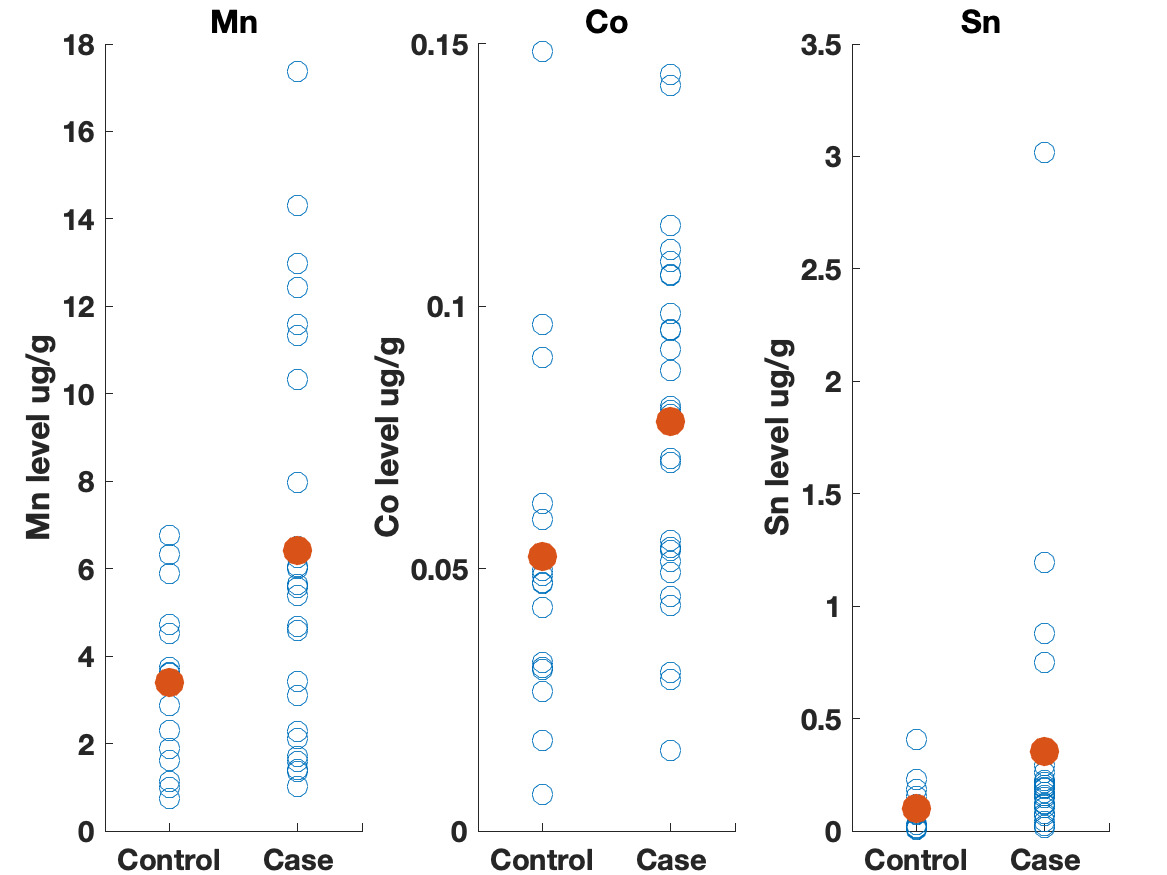
Table 3 shows the results of the logistic regression. No statistically significant differences were identified between the groups on frequency of eating uncooked cassava, going to boarding school, fumigating the living space, or burning trash. Likewise, ESR and CRP levels did not appear to differ between groups. We did observe differences, however, in the toenail metal levels. Cases had significantly higher levels of manganese, cobalt and tin (Figure 2). A correlation matrix of the toenail metal levels indicated a strong correlation between the cobalt and manganese levels (Figure 3).20

The participants provided information on their primary address. We did not find any geographical clustering of the cases. The addresses of the participants did not correlate with manganese deposit sites obtained from the Geological Survey of Tanzania.21 Few cobalt-bearing mineral sites exist in Tanzania and none of these are in the Dar es Salaam area, so no correlation could be attempted between the addresses of the participants and cobalt deposits.21
DISCUSSION
A syndrome consisting of hearing loss, often associated with vision loss and peripheral neuropathy, has been endemic in Tanzania for more than 20 years. This is among the first studies to characterize the auditory symptomatology present in these individuals. The available data strongly suggest that the hearing difficulties are consistent with an auditory neuropathy. Overall, the cases had a combination of poor audiometric thresholds with preserved DPOAE levels which point toward an auditory neuropathy. This assessment is supported by the analysis of the available ABR and acoustic reflex data reviewed by an audiologist. The combination the likely auditory neuropathy with the uncorrectable visual findings, deficits in color vision, and peripheral neuropathy strongly suggest a diffuse neuropathy that is leading to the symptoms in these young people.
The data from this study do not support an inflammatory cause for the syndrome. ESR and CRP levels in the cases did not differ significantly from the levels in the controls. This does not rule out an infectious or inflammatory cause but does make it less likely. Also, the possibility exists that there may be a genetic component to this syndrome (e.g., Usher syndrome) which we did not assess. Five of the cases answered yes to the question of whether they had relatives with similar symptoms. These data need to be interpreted with caution, because hearing loss and visual difficulties are common in the general population. When individuals answered yes to this question they might have meant that other members in the family have hearing or vision problems, not necessarily that they have an unusual neuropathy.
We found higher levels of Mn, Co, and Sn in the toenails of the cases as compared to controls. Seven of the cases had Mn levels greater than 10 ug/g, which is level higher than has been seen in most studies examining Mn levels in toenails.22 Manganese is a neurotoxin, although the signs of manganese toxicity are usually seen in the brain and not as a peripheral, visual, or auditory neuropathy.23 Cobalt is also a neurotoxin and has been shown to produce a retinopathy, auditory neuropathy, and peripheral neuropathy.24,25 The cobalt levels in the toenails correlate with the manganese suggesting a linkage between the two metals (i.e., a common source). Although the cobalt levels in the toenails within this cohort are not high compared to other studies, the fact that cobalt can produce symptoms similar to what is seen in this cohort indicates that this is an area worth further study. No clear evidence could be found for a geological origin for these metal levels. The addresses of the participants did not correlate with known manganese deposits and few geological deposits of cobalt exist in Tanzania.21
The elevated Sn levels are driven primarily by elevated levels in three of the cases. Organotin compounds are used in many industrial processes and can be source of environmental contamination. These compounds can produce neurotoxicity, although this is typically described as affecting brain function and not producing a neuropathy.26 The fact that tin levels were elevated in the toenails also supports further research on possible environmental contaminants causing this syndrome.
This was a pilot study and was not adequately powered to provide a definitive answer to why young people are experiencing this syndrome. Nevertheless, the data from the study are useful for setting a direction for future research in this area. The data do not support (but do not rule out) an effect from uncooked cassava, attending boarding school, burning trash, or exposure to insecticides from fumigation. The toenail concentrations did suggest differences in Mn, Co, and Sn levels between the cases and the controls. These findings do not prove causality, in part because they were assessed after the onset of the syndrome. Nonetheless, they suggest that a broader examination of environmental exposures to toxic metals in Tanzania is warranted. A registry of individuals with these symptoms should be considered and a more in-depth examination for potential sources of potentially harmful metals in the Dar es Salaam area should be undertaken.
Conclusions
Otorhinolaryngologists in Dar es Salaam have been presented with young adults complaining of unexplained hearing loss, often associated with poor vision and peripheral neuropathy. The causative factors have not been determined and the few studies done previously yielded inconclusive results. Patients are treated conservatively (some are given B vitamins with no improvement) and have poor outcomes. This study confirmed that the hearing difficulties in these individuals are consistent with an auditory neuropathy and provides a direction for future research. Among those with more than one symptom, manganese, cobalt, and tin levels in the toenails are greater than in controls. These metals are potential neurotoxins so a further search for potential environmental sources for these metals is warranted.
Young adults in Dar es Salaam with unexplained hearing loss should be evaluated for an auditory neuropathy and questioned about any visual or peripheral neuropathy symptoms. They should also be questioned about any unusual environmental exposures. Currently these patients are typically evaluated in an audiology, ophthalmology, or neurology clinic depending on which symptom they find most disturbing. A multidisciplinary approach could help the management of patients with this debilitating syndrome. A registry of these patients should be established to coordinate studies and foster the search for a cause. Research for the source of elevated metal levels is needed.
Acknowledgements
The Committee for the Protection of Human Subjects at Dartmouth College and the Research Ethics Committee at the Muhimbili University for Health and Allied Sciences approved this research. We thank Michael Zegans, M.D. for his assistance with selecting the ophthalmological tests used. We thank Jeffrey Cohen, M.D. for his assistance in selecting the tests to use to assess for peripheral neuropathy. We appreciate the study work of Immaculate Goima at the DarDar clinic. We thank the team at the DarDar clinic in Dar es Salaam, Tanzania who collected these data (Esther Kayichile, Safina Sheshe, Claudia Gasana, Joyce Ghatty). We thank the team at Creare, LLC. that assembled and tested the hearing testing systems. We appreciate the support of Erika Kafwimi and Sabrina Yegela who helped with building the video questionnaire and translating the questions. We thank our Dartmouth student interns Karampreet Kaur and Christiana Johnson for their assistance with assembling data. We thank Thomas Palys for his assistance with the heavy metal determinations.
Funding
The Hitchcock Foundation at the Dartmouth-Hitchcock Medical Center supported this work. Drs. Massawe, Moshi, Magohe, and Buckey also received support from grant R01DC009972 from the National Institute on Deafness and Other Communication Disorders.
Authorship contributions
E.M. was involved in conceptualization, funding acquisition, investigation, project administration, supervision, and reviewing and editing the manuscript. N.M. was involved in conceptualization, funding acquisition, investigation, project administration, supervision, and reviewing and editing the manuscript. J.R. was involved with formal analysis, software, and visualization. CCR was responsible for formal analysis of the audiological data concerning auditory neuropathy. A.M. was involved with data curation, project administration, and supervision. A.F. was involved with conceptualization, data curation, funding acquisition, investigation, project administration, supervision and reviewing and editing the manuscript. E.A. assisted with formal analysis and reviewing and editing the manuscript. C.N. assisted with reviewing and editing the manuscript. B.J. provided resources and assisted with investigation, reviewing, and editing. M.K. was involved with conceptualization, funding acquisition, supervision, reviewing and editing. J.B. was involved in conceptualization, formal analysis, funding acquisition, project administration, software, supervision, writing the original draft, reviewing, and editing. All authors agree to be accountable for all aspects of the work and ensuring that questions about the accuracy or integrity of any part of the work are appropriately investigated and resolved.
Competing interests
The authors completed the Unified Competing Interest form at www.icmje.org/coi_disclosure.pdf (available upon request from the corresponding author), and declare no conflicts of interest.
Correspondence to:
Enica Richard Massawe
Department of Otorhinolaryngology, Muhimbili University of Health and Allied Sciences (MUHAS), Dar es Salaam, Tanzania.