

Nearly all of the annual, global neonatal death toll of 2.6 million infants occur in low and middle income countries due to complications from preterm birth, intrapartum related events (e.g., birth asphyxia) and infections. Recently, efforts to develop the evidence base for low-cost efficacious interventions that can reduce neonatal mortality in these settings have demonstrated the critical role of neonatal skin, which provides robust innate immunity, antibacterial defense and protection. Intervention studies have included kangaroo mother care
KMC), umbilical cord cleansing with chlorhexidine, and topical emollient application. Skin care, whether part of routine home-based traditional practices (e.g., neonatal massage), or incorporated in interventions such as KMC or emollient therapy, may impair or enhance skin barrier effectiveness. Additionally, environmental temperature and humidity impact stratum corneum (SC) development. A compromised or under developed neonatal skin barrier increases the risk of exposure to irritants and infectious agents. Given the importance of these interventions, an improved understanding of their effects on skin development and function is critical to the design and delivery of optimum interventions at the bedside.
Of particular importance, especially in South Asia, is the role of topical applications of natural vegetable oils to newborn infant skin. The impact of this traditional practice on skin development and function may depend upon the type of oil(s) being used. In animal studies, application of sunflower seed oil (SSO) accelerated barrier repair, while the use of mustard oil (MO) delayed it.1 This finding prompted studies among preterm infants to compare the use of SSO versus no treatment on blood stream infections and skin condition; these studies have largely demonstrated reduced risk of nosocomial infection and improved skin condition.2–5 We recently extended this work to a broader population-based sample (i.e., all babies, regardless of gestational age) in rural Nepal, where MO is widely used for routine, daily neonatal massage.6 We quantified the skin barrier integrity among premature and full-term infants receiving SSO or MO nested within a larger cluster-randomized trial.7 Particularly notable was the rapid increase in skin rash that peaked after two weeks and regressed somewhat by day 28. This has not been reported in previous studies under controlled conditions, likely due to lower humidity, where rash was not found,8–10 or reported at very low levels (0.5%–8.5%).
As the research aimed to understand the effects of topical emollients on skin barrier status, we further investigated the causes and physiology of this rash. Digital imaging has been applied in clinical settings to improve objectivity, quantify particular skin features (e.g., erythema)11–13 and to assess treatment effects.14–16 We obtained standardized high-resolution digital images from a subset of 216 subjects during their regular visits. These babies were enrolled after the high occurrence of visual rash became evident to the investigators. The protocol was amended to include image collection and analysis during the latter study period. Image features were characterized and compared to the visual scores and instrumental measures17 and further quantified using objective measures of color and texture. The color images were separated into distinct channels to quantify red color, yellow color and lightness/darkness. Several features of skin texture, including rash, were noted and characterized by judging the area of involvement and severity. We applied a statistical, matrix-based image analysis algorithm, known as gray level co-occurrence matrix (GCLM), to identify patterns in the image. We describe the findings and physiological features of the rash.
Methods
Setting and parent trial
Images were collected from approximately 20% infants enrolled in a 1000 subject cluster-randomized study nested within a larger trial (ClinicalTrials.gov, NCT01177111) to determine the impact of topical skin emollient application on neonatal mortality and morbidity in Sarlahi District, Nepal.7 Communities in the larger trial were randomized to promotion of full-body topical treatment (“newborn massage”) with either SSO (intervention) or MO (comparison), the nearly universal traditional practice in Nepal.6 For communities with prior neonatal death statistics, randomization was restricted to ensure risk balance. Quasi-randomization was performed for districts without death data (LCM). It was not possible to blind study personnel due to differences in odor of the oils. SSO and MO were purchased from Shiv Shakti Ghee Udyhog Pvt. Ltd (Jitpur, Nepal) every 4-6 weeks and stored at site headquarters at room temperature.
Nested study
Briefly, all premature and a randomly selected 20% sample of full-term, live-born infants were enrolled between July 2012 and May 2014 to achieve a 1:1 ratio of premature/full-term infants.7 After obtaining informed consent from mothers for infant participation, specialized field workers conducted study measurements on days 1, 3, 7, 14 and 28.
Ethics
The ethics review committee of the Institute of Medicine, Tribhuvan University (Kathmandu, Nepal) and the Institutional Review Board of the Johns Hopkins Bloomberg School of Public Health (Baltimore, MD) approved the study.
Digital image acquisition
Digital images from an approximate 20% subset of babies were acquired with a 16-megapixel Pentax WG-3 digital camera with a 1/2.3-inch backlit complementary metal oxide semiconductor sensor and a Pentax 4x optical zoom f/2-4.9 lens (Ricoh Imaging Company, LTD, Tokyo, Japan) for low-light sensitivity and quality suitable for obtaining high quality images under home lighting. Image standardization was achieved by placing black, gray and white color standards and a 2 cm scale bar on a template demarking the chest region of interest.16 Images were taken perpendicular to the chest at a fixed distance (25 cm).
Visual image evaluation
The images were color corrected (Adobe Photoshop, Adobe, San Jose, CA, USA), cropped and saved.16 Blind visual evaluation of miliaria and texture severity (MOV) was based on area of involvement, following procedures in previously published skin assessments,18 and scored as follows: area <2% = score of 0.5; 2-10% = 1.0; 10-50% = 1.5; ≥50% = 2.0.
Image processing color
Corrected images were converted to the International Commission on Illumination (CIE) Lab color space as it more closely correlates to human color perception,19 split into L* (light-dark), a* (red-green) and b* (blue-yellow) channels and analyzed separately (ImageJv1.47g, National Institutes of Health, Washington, DC, USA). Lxa*, Lxb*, a*xb* and skin chroma, i.e., color saturation20 as Chroma (C*) was computed as:
C∗=((a∗)2+(b∗)2)1/2
Image processing texture
Skin surface texture is influenced by barrier properties (e.g., hydration), dermo-epidermal architecture, and dermal collagen structure. High and low points in an image create the observed textural features. Images were converted from color (Figure 1, Panel A) to gray scale (Figure 1, Panel B) where there are 256 shades of gray from white to black. Texture features can be obtained using the gray level co-occurrence matrix (GLCM), a statistical matrix analysis technique that determines spatial relationships among gray level image pixels21,22 (ImageJv1.47g, National Institutes of Health, Washington, DC, USA).23 It determines how often pairs of pixels with certain values and a specified relationship occur relative to each other. Figure 1, Panel C is a greatly magnified version of Figure 1, Panel B showing the image white, gray and black pixels. The GLCM texture outcomes were: (i) angular second moment (ASM, uniformity) that is mathematically the squared sum of GLCM elements, (ii) contrast (local gray level variation), (iii) correlation (gray level linear dependency), (iv) inverse difference moment (IDM, homogeneity) and (v) entropy (randomness or disorder).24–26 Additional details of the GLCM method are provided in the Online Supplementary Document).27

Skin measurements
Skin integrity was assessed on days 1, 3, 7, 14 and 28 for visual erythema, rash and dryness, skin surface pH, transepidermal water loss (TEWL, g/m2/hr), protein concentration, heat index, temperature, and humidity.17
Statistical analysis
Images of poor quality, e.g., glare, poor focus, shadows, were eliminated (n=63). GLCM outcomes were analyzed as log10. Imaging outcomes and skin measurements were analyzed over time with univariate general linear models (GLM) with P<0.05 (SPSSv24.0, SPSS, Inc., Chicago, IL, USA) and included appropriate covariates, e.g., treatment group. The effects of gestational age (GA) were evaluated by classifying the subjects into three groups as follows: Group 1: < 34 weeks GA, Group 2: 34-< 37 weeks GA, and Group 3: full-term (≥ 37 weeks GA). The effects of GA group and image type were determined with GLM and controlled for study day and treatment group. The method of Bonferroni was used for post-hoc pairwise comparisons.28 Oil treatment effects were evaluated over 28 days using linear mixed models repeated measures procedures with day as the repeat (P<0.05).
Results
Subjects
The nested trial enrolled 995 infants. A total of 216 babies were enrolled following the addition of digital imaging to the protocol, i.e., in the latter study period. From them, 811 usable images were evaluated. Subject demographics for the imaging subset and by GA group are in Table 1.
Qualitative image features
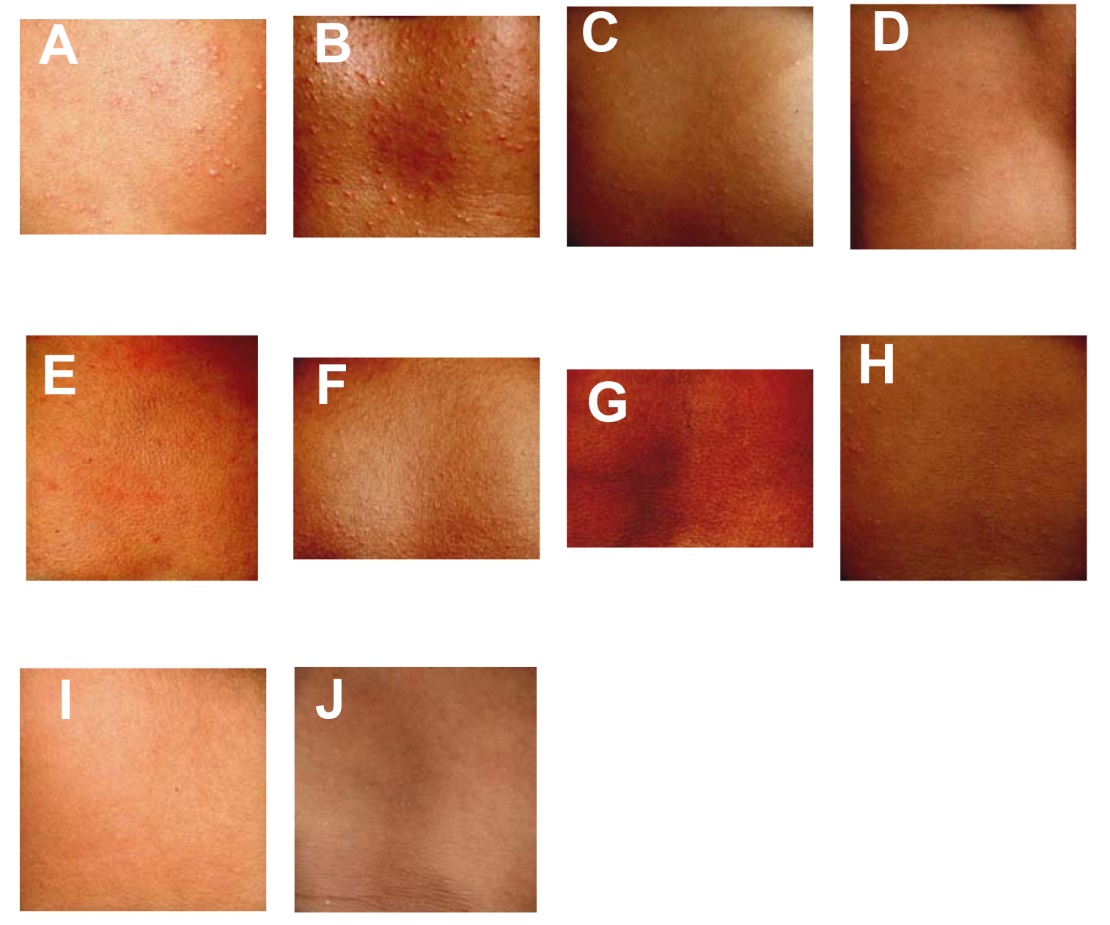
Skin features were observed in 403 of 811 images, including localized erythema, discrete papules and an occasional pustule. Miliaria crystallina was noted in 261 images (32.2%) and miliaria rubra in 18 (2.2%). Miliaria were typically ~0.5 to 1.2 mm in diameter ~ 1-5 mm apart in no particular pattern. Representative images of severity values 1.5–2 are shown in Figure 2, Panels A-D.
A second texture, raised, “pebble” like features, characterized 26% of the images. Of 216 subjects, 61% had the “pebble texture”, where 36% showed it once and 14.4% at 3-5 of the total visits (Figure 2, Panels E-H). The “pebble” regions were ~ 1 mm in diameter. Coalescence to 1.5 mm clumps was also observed. Within the “pebble” regions, smaller ~ 0.5 mm diameter sites were visible (Figure 2, Panel G). Unlike miliaria, “pebble” regions were often closer together. Images in Figure 2, panels I and J have neither miliaria nor “pebble” texture.

Miliaria and texture severity over time
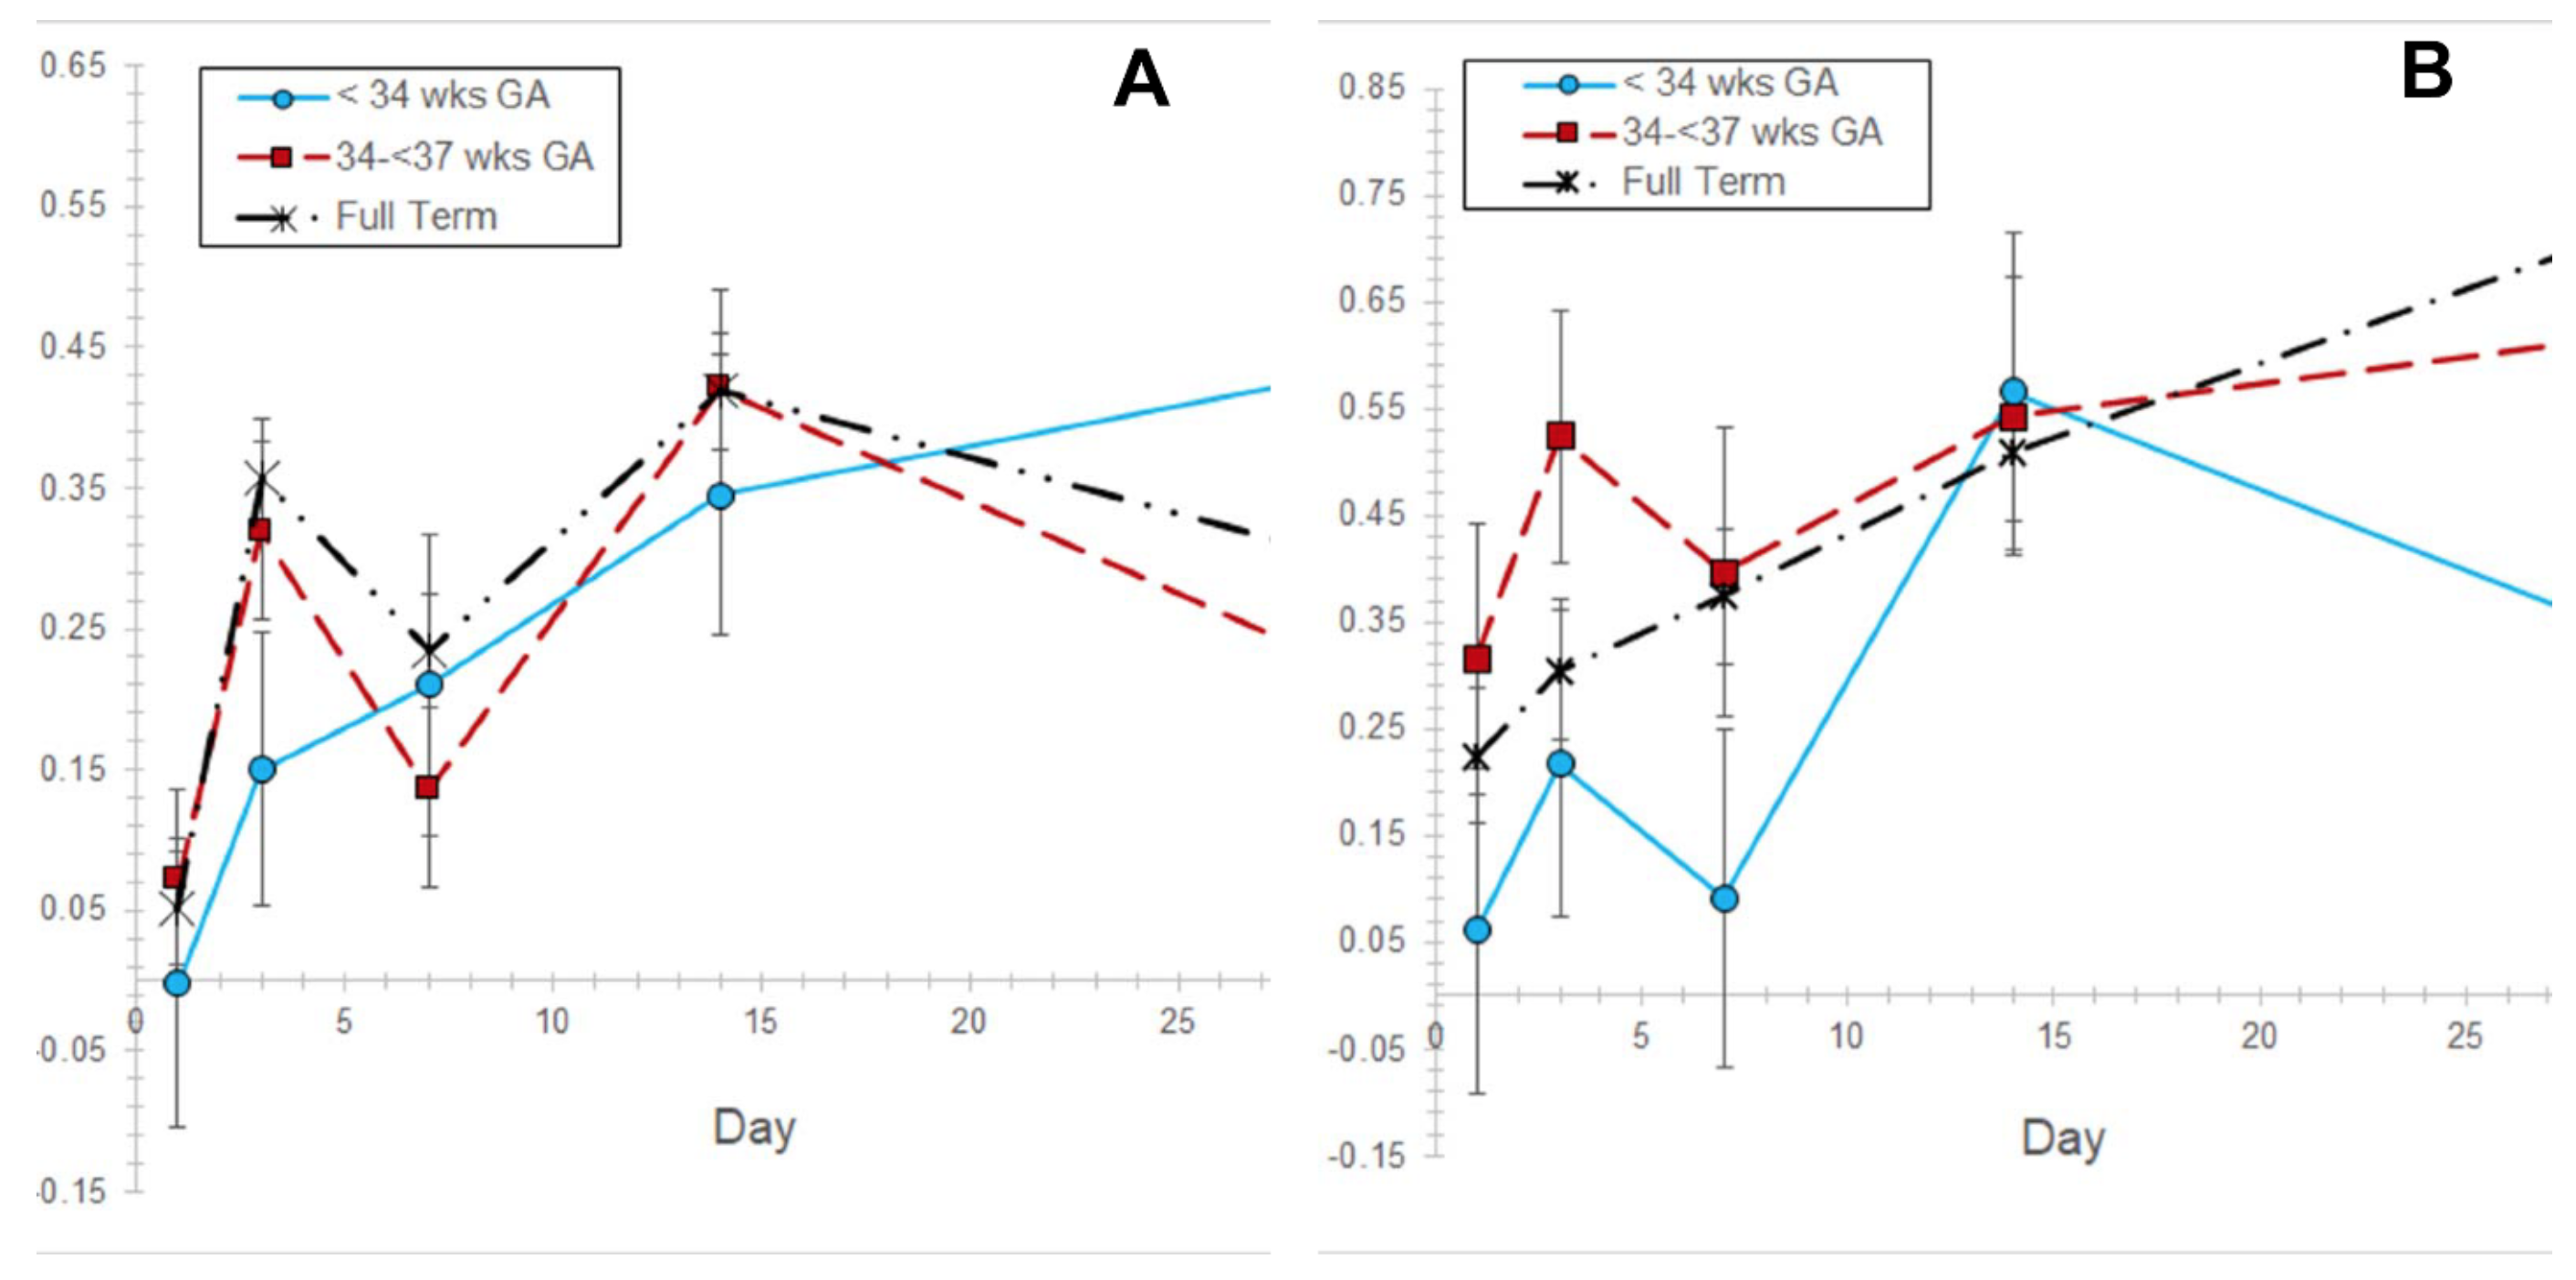
Miliaria severity increased with day 1 being lower than all other days and day 14 being higher than days 1 and 7 (P<0.05) (Table S1 in the Online Supplementary Document). Miliaria increased for each GA group, with higher scores on day 14 for infants 34-<37 weeks and term babies (P<0.05) (Figure 3, Panel A). Pebble texture severity increased (P<0.05), with days 1, 3 and 7 being lower than day 28 (P<0.05) (Table S1 in the Online Supplementary Document). It was higher on days 14 and 28 than on day 1 in term babies (Figure 3, Panel B).
Skin integrity and function
Skin outcomes were comparable to those for the full study population.17 Rash was lower on day 1 than all other days (P<0.05) and higher on day 14 than on days 1, 3, and 7 (P<0.05). On any given day, there were high occurrences of no rash, i.e., score of 0 with percentages of 83, 53, 50, 34, and 44 for days 1-28, respectively. However, 93% of subjects had visible rash on at least one day. Skin pH decreased with days 1, 3 and 7 higher than all other days (P<0.05) (Table S2 in the Online Supplementary Document). Erythema was higher on days 3 and 14 than on day 28 (P<0.05). TEWL was higher on day 28 than on day 3 (P<0.05). Protein concentration was higher on day 1 than on days 7, 14 and 28 (P<0.05).
Relationship of miliaria and texture with skin integrity and study conditions
The effects of miliaria or texture on skin integrity were evaluated (Table 2). For miliaria, pH was lower and erythema, rash and massage numbers (24 hours) were higher than without miliaria (P<0.05). Skin pH, TEWL, protein erythema and rash were not different for with and without pebble texture.
Color outcomes over time
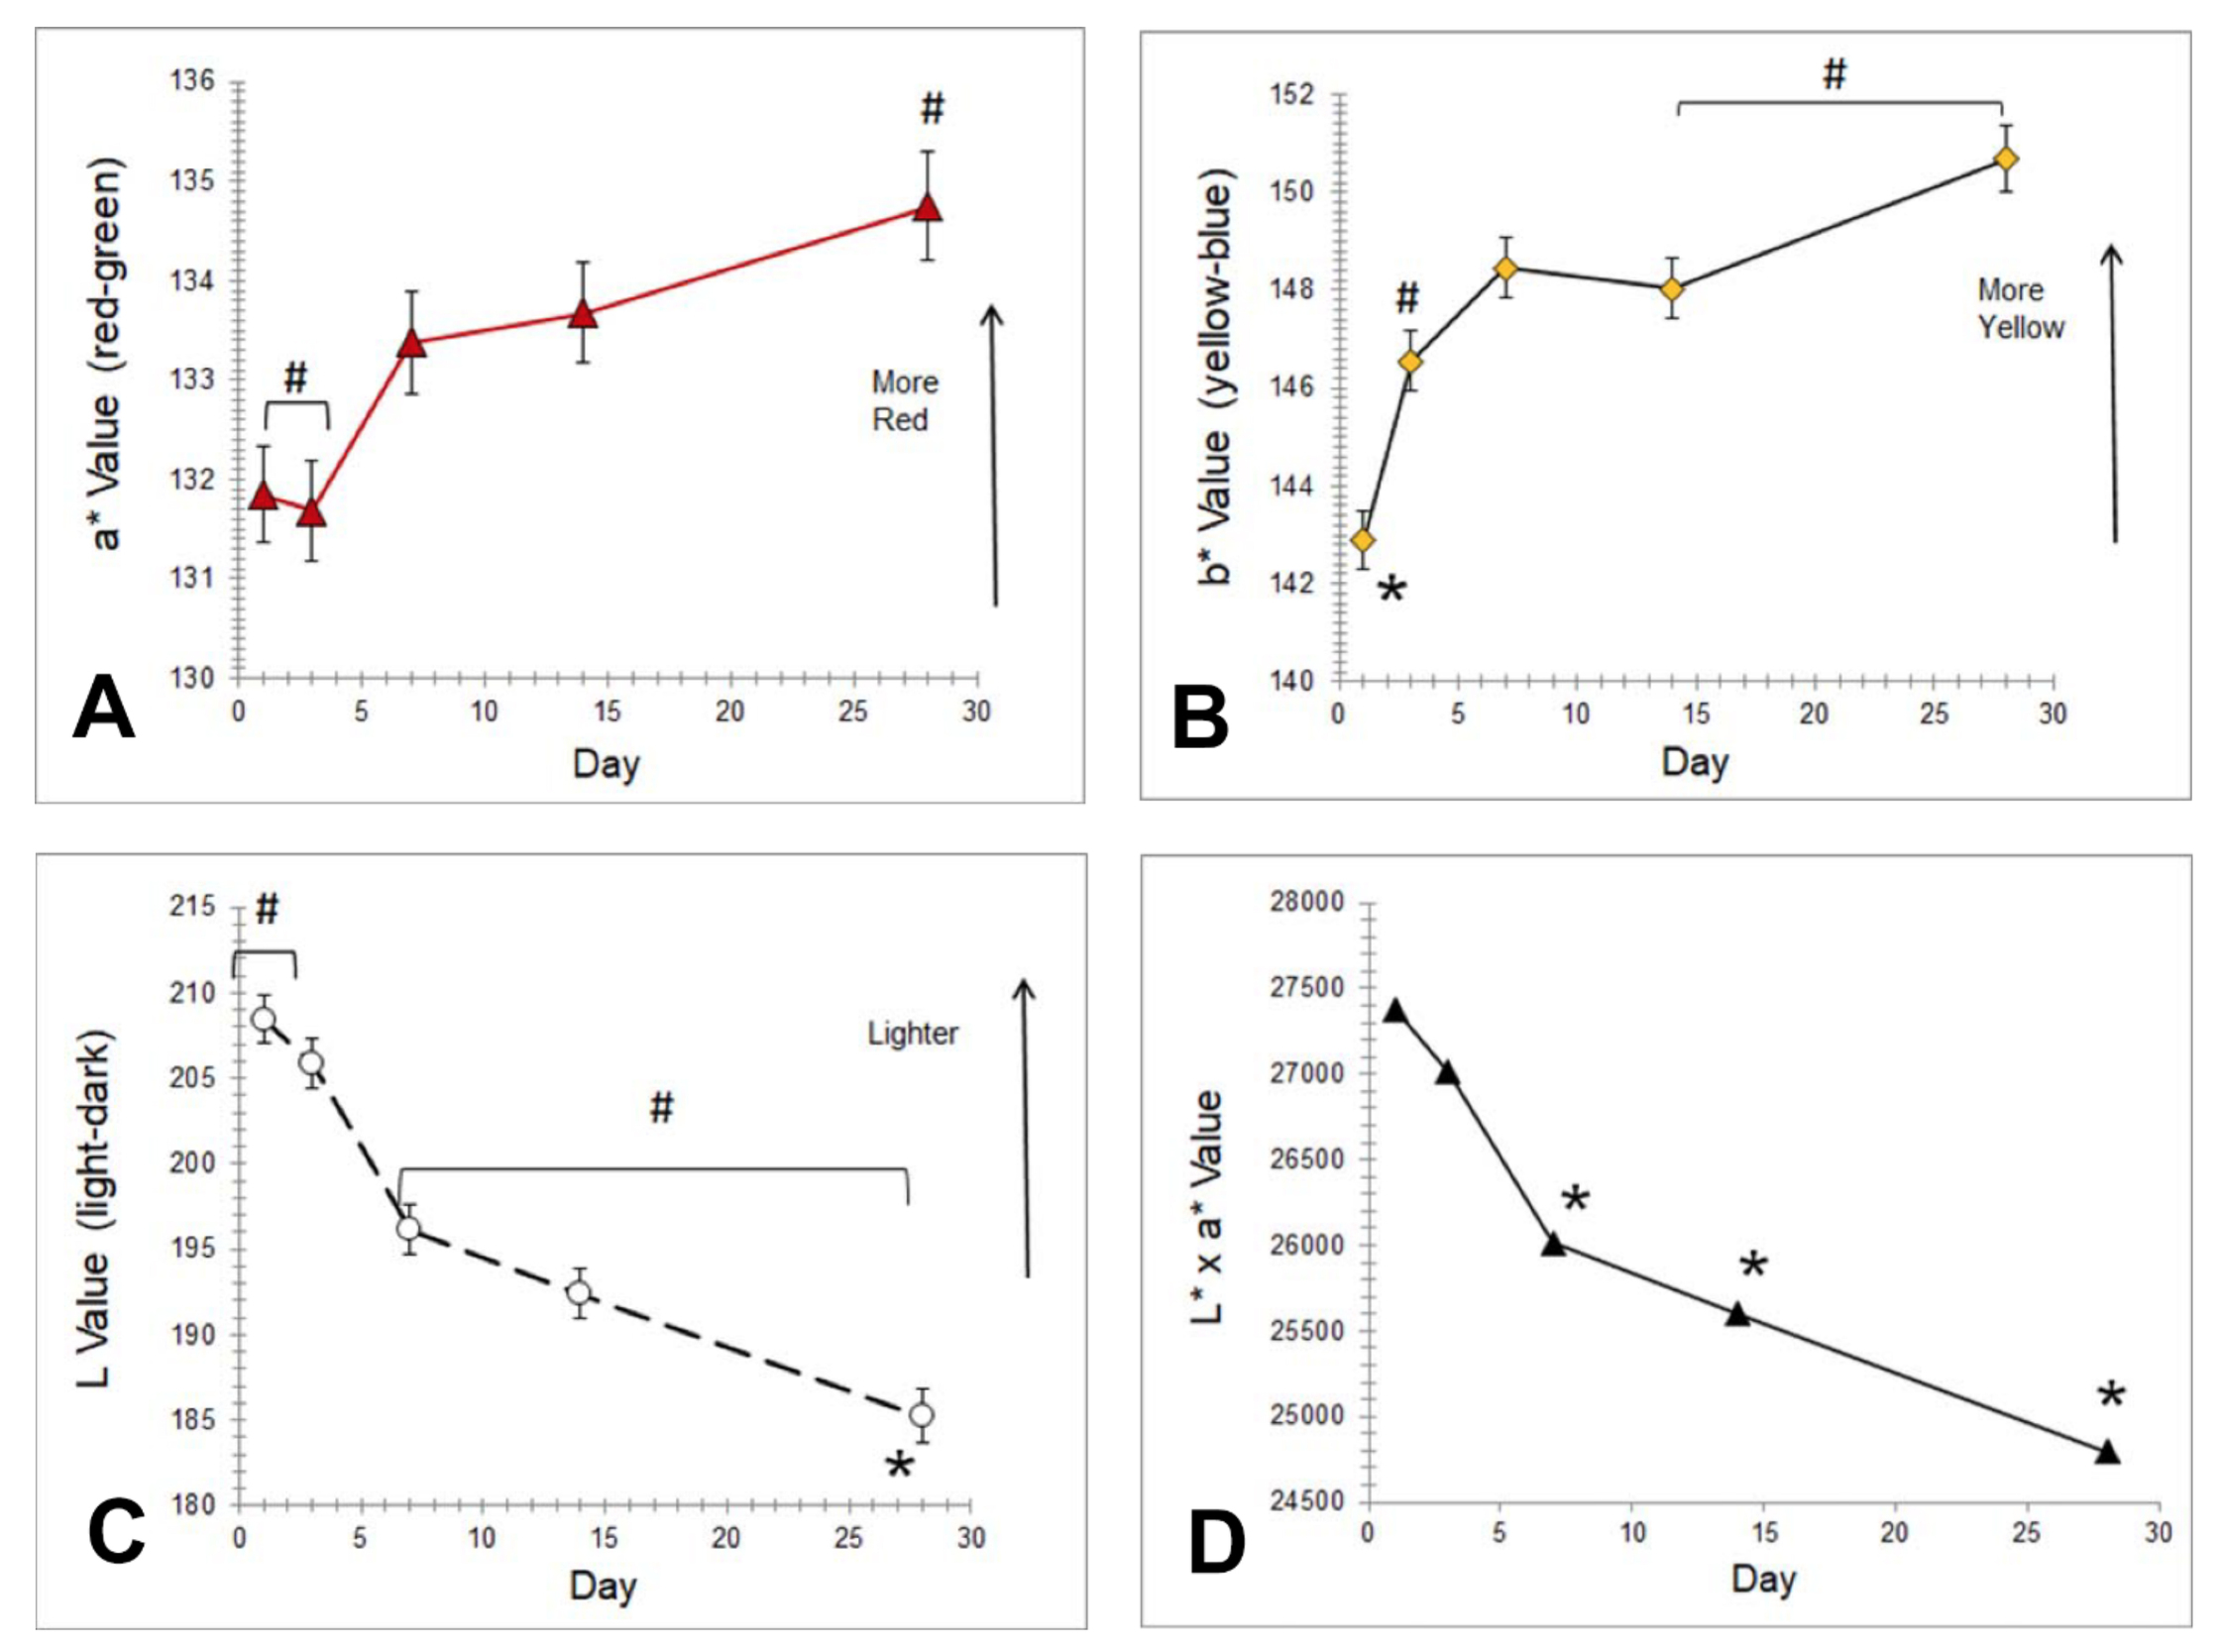
Red color (a*) decreased with day 28 being lower than all others (P<0.05) (Figure 4, panel a). Skin lightness (L*) decreased, with day 28 being darker than all other days (P<0.05) (Figure 4, Panel B, and Table S2 in the Online Supplementary Document). Chroma increased with day 1 being lower and day 28 being higher than all other days (P<0.05). L*xa* decreased, with days 7, 14 and 28 being lower than all other days (P<0.05) (Figure 4, panel c). Yellow color (b*) was higher on day 3 than on days 1 and 7 (P<0.05) (Figure 4, Panel D).
GLCM outcomes over time
Changes in GLCM outcomes were observed (Table S1 in the Online Supplementary Document). Uniformity (ASM) was higher on day 28 than all days and higher on day 14 than on day 1 (P<0.05). Contrast (variation) was lower on day 28 than all other days (P<0.05). Correlation was lower on days 1 and 3 than on day 28 (P<0.05). Entropy (randomness, disorder) decreased with days 1 and 3 being lower than on days 14 and 28. Homogeneity (IDM) was higher on day 14 than on days 1, 3, and 28 (P<0.05).
Image comparison by type and time
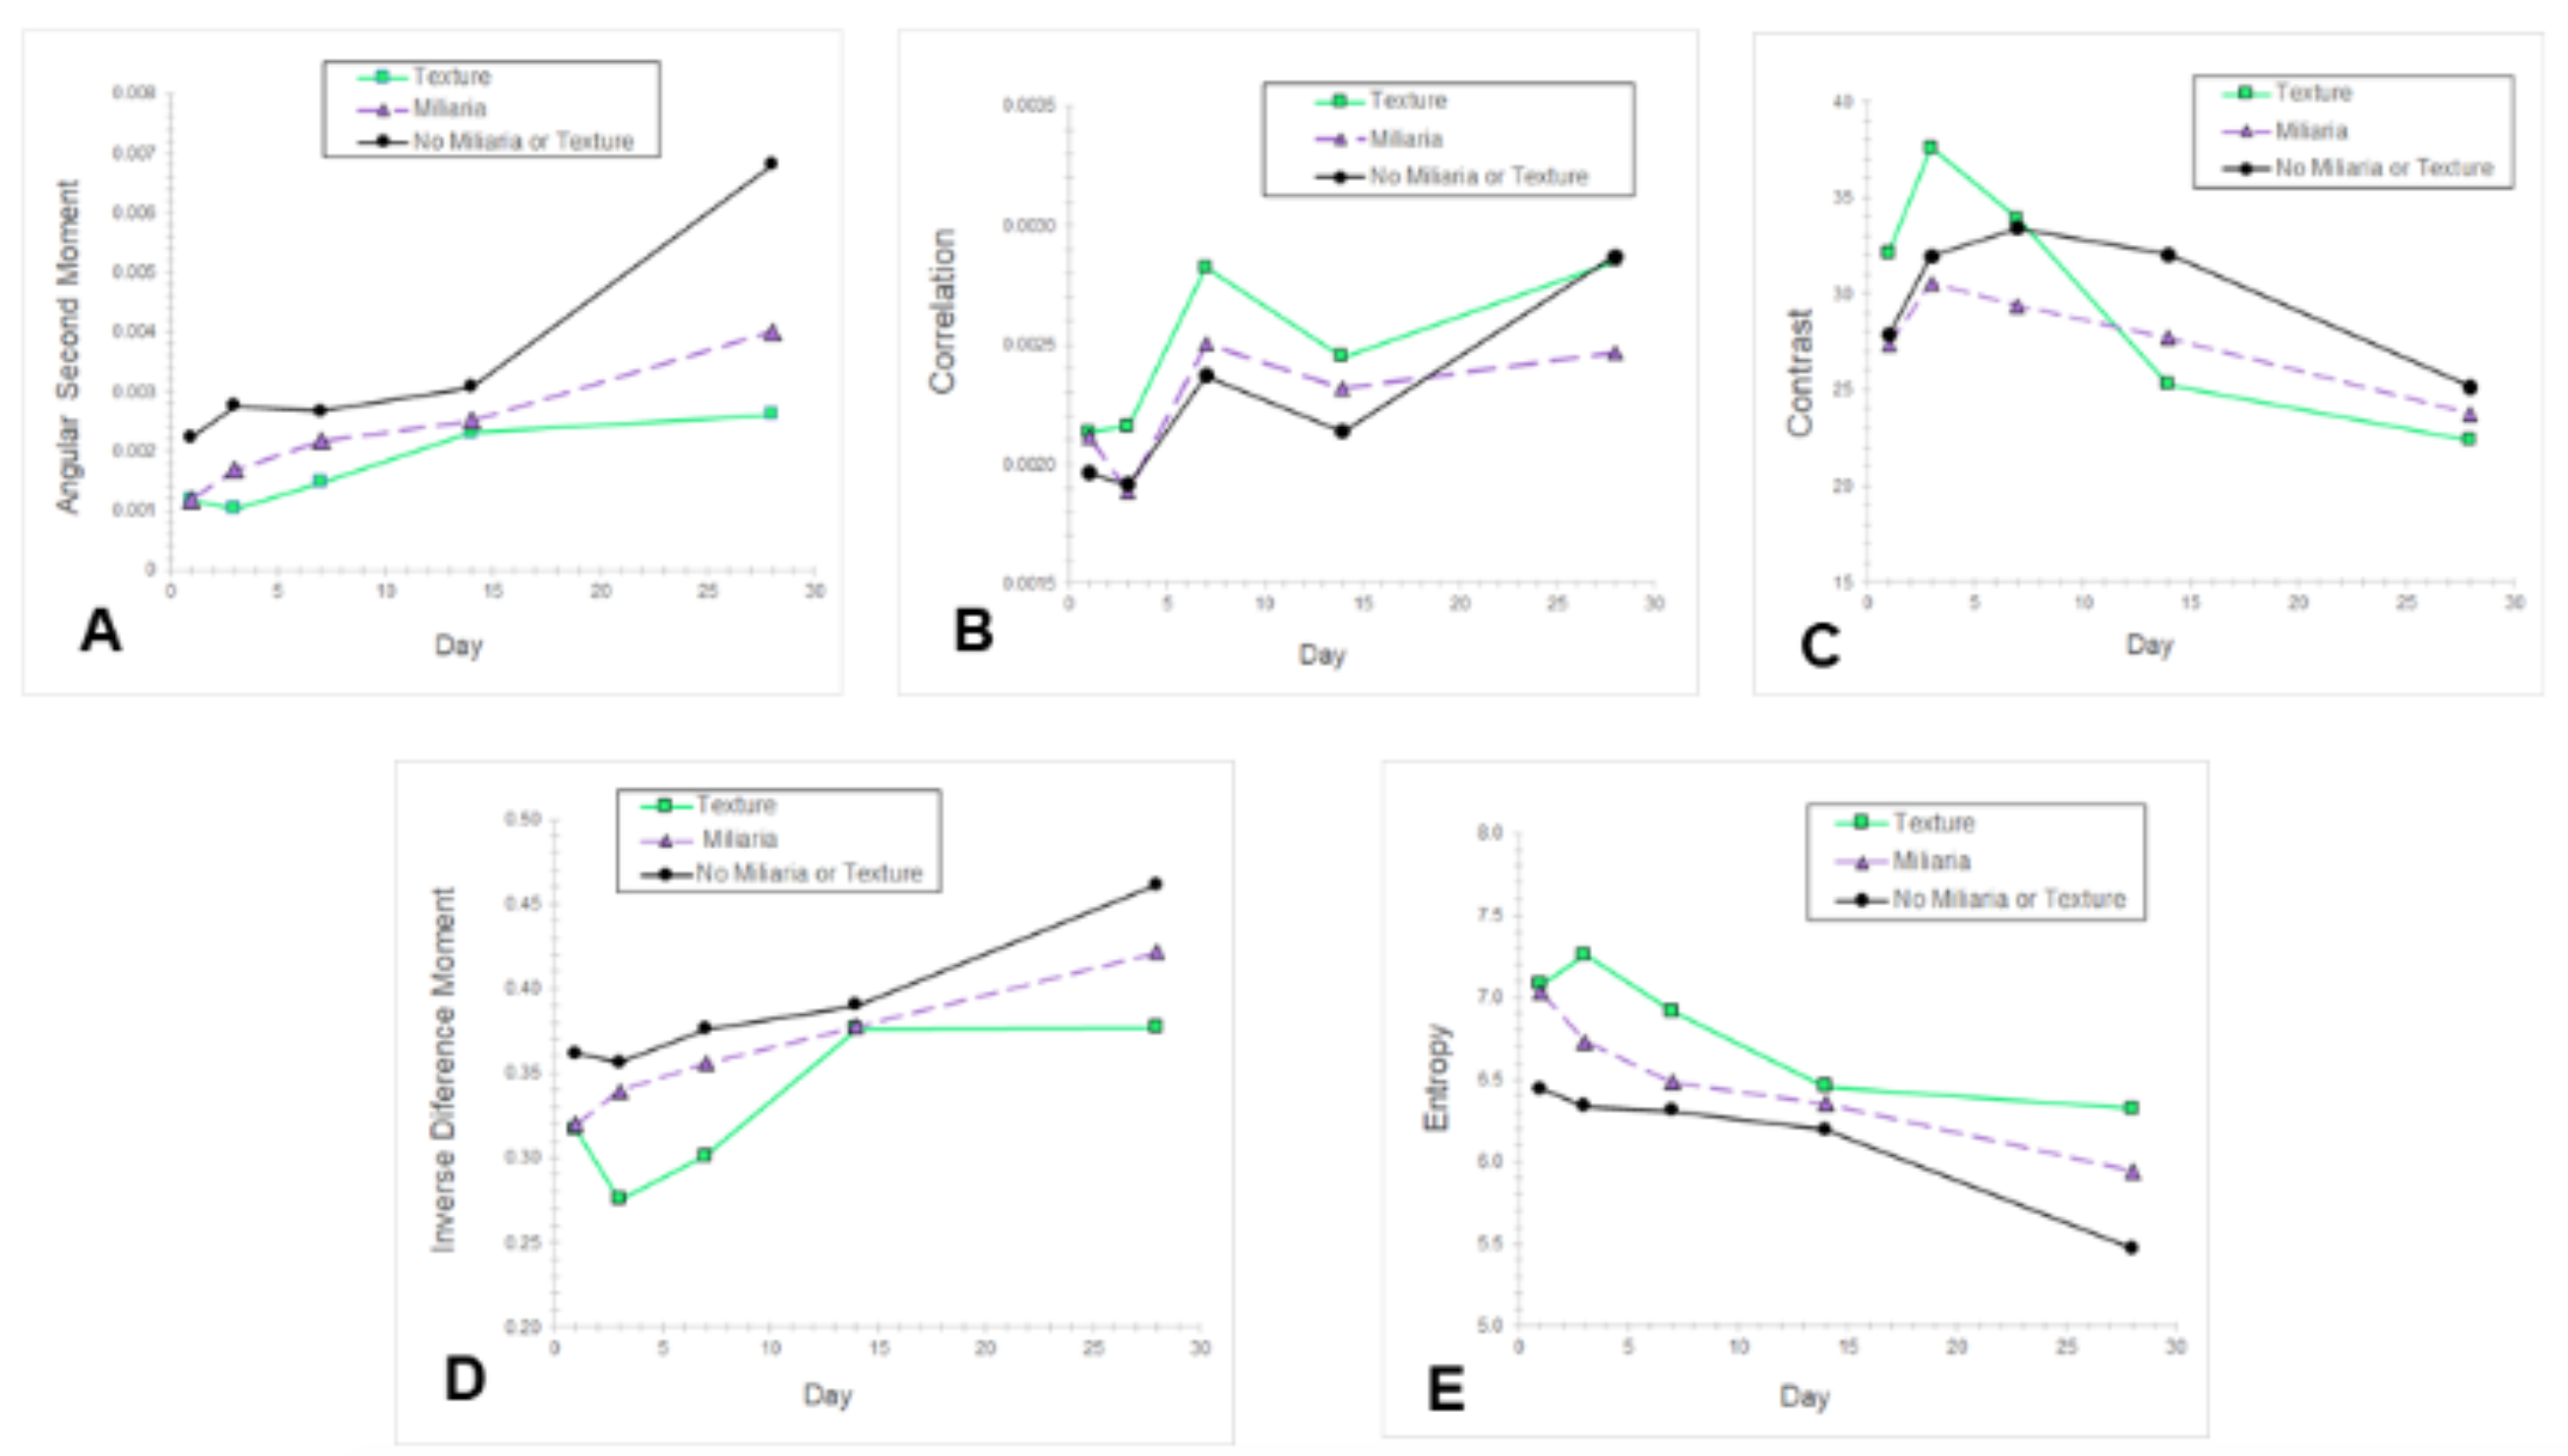
Contributions of miliaria and texture were examined by classifying images as: (1) no miliaria or texture, (2) miliaria only and (3) texture only. Changes over time were examined for each class and compared (all visits combined).
Uniformity (ASM), homogeneity (IDM) and randomness (entropy) changed for each class (Figure 5, Panel A). Images without miliaria or texture showed the greatest uniformity (ASM) increase, with day 28 higher than all other days (P<0.05). It was higher on day 28 than on days 1, 3 and 7 for miliaria or texture (Figure 5, Panel A) (P<0.05). Homogeneity (IDM) was higher for miliaria and texture on day 28 than on days 1, 3 and 7 (P<0.05) (Figure 5, Panel B). Entropy (randomness) was lower on day 28 than all other days for images without miliaria or texture (P<0.05) (Figure 5, Panel C). It was lower on day 28 than on days 1, 3 and 7 for miliaria or texture (P<0.05). Correlation was higher on day 28 versus days 1 and 3 for no miliaria or texture (P<0.05) (Figure 5, Panel D). Variation (contrast) was lower on day 28 than on days 3, 7 and 14 and lower on day 7 than day 1 for no miliaria or texture (P<0.05) (Figure 5, Panel E).

Uniformity (ASM) differed for all types (Table 3). Images with no miliaria or texture had the highest uniformity. Images with texture had lowest uniformity (P<0.05). Entropy (randomness, disorder) differed for all types with the lowest values for no miliaria or texture and highest for texture (P<0.05). Homogeneity (IDM) was lower for texture versus miliaria and no miliaria or texture (P<0.05).
Effect of oil treatment
Miliaria severity, texture severity, GLCM and color outcomes did not differ for SSO versus MO (data not shown).
Discussion
Neonatal skin routinely massaged with topical emollient in the high temperature and humidity of rural Nepal exhibited changes in texture and color over the first postnatal month. Miliaria crystallina and “pebble-like” skin texture was identified in many images (Figure 2, Panels A-J). Miliaria was most frequent on day 14 and regressing by day 28, similar to the rash score. The “pebble” texture severity increased. Miliaria was associated with epidermal barrier inflammation as indicated by higher erythema and rash, as well as reduced skin pH and more massages in 24 hours (Table 2). In contrast, skin texture was not associated with the measures of skin barrier integrity but linked with higher gestational age and heat index (Table 2). The skin darkened and redness decreased, likely constituting maturation/adaptation after birth. To our knowledge, this first reports skin textural (qualitative, quantitative) and color changes in premature and full-term neonates, extending our understanding of skin barrier maturation. It is the first to delineate the frequency and severity of neonatal miliaria receiving routine oil massage in high humidity and temperature conditions.
Calculated texture outcomes (GCLM) indicated a more uniform (ASM) and less random (entropy) skin surface for images with no miliaria or texture (Figure 5, Table S1 in the Online Supplementary Document) over the neonatal period. The presence of “pebble” texture or miliaria each decreased the skin surface uniformity and increased the randomness (Figure 5, Panels A and C).24–26 The presence of “pebble” texture increased the randomness (entropy) relative to no “pebble” texture or miliaria (Figure 5, Panel C). Images with miliaria were more random than images with no visible textural features (Figure 5, Panel C).
Miliaria occurs from: (i) blockage of eccrine gland openings by keratin plugs formed via stratum corneum maceration from water or sweat29; (ii) increased density of infectious microorganisms (Staphylococcus aureus, coagulase-negative staphylococcus)30,31; and/or (3) formation of biofilms from extracellular polysaccharide substances.29 Miliaria are typically 1-3 mm in diameter and blockage can occur at various depths: at the SC (miliaria crystallina), in the epidermis (miliaria rubra) or in the dermis (miliaria profunda).32 Neonatal miliaria occurred in high temperature conditions where oils are topically applied to skin.33
The presence of miliaria may reflect immaturity in eccrine gland function and thermoregulation. Sweating was not observed before 31.4 weeks but increased by 32.8 weeks.34 The sweating rate for infants ≥ 36-40 weeks was 0.109 ± 0.031 microliter/cm2 at postnatal days 4-14, suggesting eccrine gland maturation. Active gland density was 414 glands/cm2 versus 64 glands/cm2. Continual sweat gland stimulation produced miliaria. The relative absence of miliaria on day 1 followed by increases until day 14 may indicate eccrine gland immaturity, with some resolution by day 28 when normal sweating has begun. Topical oil application may contribute to eccrine gland blockage and water retention to cause miliaria.
Reports on neonatal skin surface texture are sparse. It arises in part from the three-dimensional structure and organization of dermal collagen.35 Fetal and neonatal dermis is less organized/structured than adult dermis.36 Infant collagen bundles are less dense.37 The SC and epidermis were thinner (30 and 20%, respectively) and the dermatoglyphics were denser in 6-24 month infants versus adults.38 Regular networks of dermal elastic fibers are not fully developed until 12-24 months.39–41 The observed texture changes in ASM, IDM and entropy, may be due to dermal maturation during the first postnatal month.
The “pebble” texture was somewhat reminiscent of thickening or lichenification. During development, mechanical forces might convert to biochemical reactions via mechanotransduction.42,43 Mechanical stress increases dermal collagen fibril diameter and decreases fibril density.44 These factors raise the possibility that massage causes mechanotransduction and assists in dermal maturation that, in turn, manifests in the surface texture.
The skin became less red and darkened over 28 days (Figure 4). Skin color arises from light interacting with melanin, hemoglobin, deoxyhemoglobin, and carotene.45 Melanocytes synthesize melanin and transfer it to keratinocytes.46 The redness and lightness changes may be maturational and not related to skin, erythema or rash but due melanin. Pigmentation increased over the first six months among infants in New Guinea.47 Consistent with our results, skin darkening over 60 days in African American infants was attributed to increased pigmentation.48
Some specific study features were noteworthy, as they emphasize the utility and potential limitations. We did not have infants who received massage without oil or topical oil without massage to elucidate the effects on miliaria, texture and skin maturation. This information is not relevant to the study population where routine daily massage is the cultural norm.6 A neonatal study at lower humidity is warranted to discern the impact of moisture and sweating on texture. When feasible, use of in vivo methods techniques may assist in discerning the epidermal and dermal changes associated with the skin surface textures.49
Conclusions
Maturational changes in qualitative and quantitative skin color and texture were observed in the community setting of rural Nepal. Color became less red and darkened. Texture uniformity increased, randomness decreased and both were altered by miliaria and the “pebble” features. The improved understanding of these changes and their associated physiological basis provides the foundation for further optimization of skin care practices.
Acknowledgments: The Ethical Review Committee of the Institute of Medicine, Tribhuvan University (Kathmandu, Nepal) and the Institutional Review Board of the Johns Hopkins Bloomberg School of Public Health (Baltimore, MD) approved the study.
Funding: Funding was provided by the National Institute of Child Health and Development (HD060712) and the Bill & Melinda Gates Foundation (OPP1084399).
Authorship contributions: MOV made substantial contributions to design, analysis and interpretation of data; drafting the article with critical revision for important intellectual content; final approval of version to be published. AS made substantial contributions to conception and design, acquisition of data, analysis and interpretation of data; drafting the article with critical revision for important intellectual content; final approval of version to be published. VN, SK, JS, JK, JT, SL made substantial contributions to conception and design, acquisition of data; interpretation of data; final approval of version to be published. LCM made substantial contribution to conception and design, acquisition of data, analysis and interpretation of data; drafting the article with critical revision for important intellectual content; final approval of version to be published.
Competing interests: The authors completed the Unified Competing Interests form at www.icmje.org/coi_disclosure.pdf (available on request from the corresponding author), and declare no conflicts of interest.
Correspondence to:
Marty O Visscher, PhD
Skin Sciences Program
Cincinnati Children’s Hospital Medical Center and University of Cincinnati,
255 Eden Ave, Cincinnati, Ohio 45267, USA
[email protected]