Perinatal and neonatal periods are vulnerable times for children globally and disproportionately affect low- and middle-income countries. Approximately 4 million newborns and 3 million fetuses die each year in low- and middle-income countries. In a study enrolling approximately 17,000 women from Chimaltenago region in the western highlands of Guatemala, perinatal mortality in 2013 was 31.6 (95% confidence interval, CI=27.2-36.7) deaths per 1,000 births.1
Intrauterine growth restriction (IUGR) is the single largest contributing factor to perinatal mortality in non-anomalous fetuses.2 Identifying small for gestational age (SGA) is often the first step in identifying IUGR. The question becomes what constitutes SGA and how is it determined in this Guatemalan Mayan population?
Prenatal Ultrasounds are frequently used to help address various clinical questions including pregnancy location (intra vs extrauterine), gestational age, placental location, fetal viability, number of fetuses, fetal position, etc. It has also been used to address fetal wellbeing, including the biophysical profile and intrauterine growth. Intrauterine growth can be assessed by comparing to “norms” and classifying the fetus as normal, large or small for gestational age.
Small for gestational age (SGA) comes in two very different forms. The first is the constitutionally small fetus. This is defined as the estimated fetal weight (EFW) or birthweight below the 10th percentile for gestational age. This form of SGA is attributed to genetic growth potential without associated negative birth outcomes, i.e. small parents, small child. This contrasts with the other form of SGA that comes from intrauterine growth restriction (IUGR). IUGR is caused by a pathological process (eg. placental insufficiency), associated with EFW< 10th percentile (but not always), and is at increased risk of adverse outcomes. These adverse outcomes include perinatal complications (fetal morbidity and mortality), iatrogenic prematurity, fetal compromise during labor, need for induction of labor and cesarean delivery. An excellent review of Intra uterine growth restriction can be found on Medscape.3 Table one provides a comparison between the two types of SGA – constitutionally small (CS) and intrauterine growth restricted fetus.3,4
Historically there have been few “standard growth curves” that have been used universally. The Hadlock formula created in 1984 is still commonly used throughout the world and the growth curves generated are applied to pregnancies irrespective of the ethnicity of the mother.5
The reoccurring question is: are these curves representative of the various ethnically diverse populations? The INTERGROWTH-21st Project created international growth and size standards for fetuses to help answer this very question.6 The goal of that study was to create intrauterine growth curves that would be applicable for fetuses throughout the world.
As the authors themselves noted,
"the inevitable and recurrent question related to the implementation of international, prescriptive growth standards (including ours) is whether or not they can be generalized to all populations."6
Another approach is to create intrauterine growth curves based on Customized Fetal Growth Percentiles.7 This concept identified certain characteristics that consistently effected the growth of the fetus namely, maternal ethnicity, parity, pre-pregnancy height and weight, and fetal sex.8,9
Recent analysis of a National Institute of Child Health and Human Development (NICHD) study10 generated gestational age estimation formula and compared this to Hadlock’s formula, developed in 1984 and noted increased accuracy and provided the following conclusion.
"The NICHD gestational age estimation formula is associated with smaller errors than a well-established historical formula. Racial and ethnic-specific formulas are not superior to a racial–ethnic-neutral one."
Guatemala is made up of 41.7% Mayan.11 The Tz’utuhil and Kachiquel are two indigenous Mayan populations that reside adjacently on the shores of Lago de Atitlán in the highlands of Guatemala. Recently these Mayan populations’ obstetrical characteristics were described and it was noted that the average maternal height was 1.49 meters.12 In the USA, the average maternal height is 1.62 meters.13 It would seem plausible that there is a genetic or environmental factor(s) influencing the maternal height and hence the growth of the developing fetus.
There is no known intrauterine growth curve specific to this Mayan population. The goal of this study was to create an intrauterine growth curve specific to this population and to compare it to a previously published growth curve/formula – the NICHD gestational age estimation formula.10
METHODS
This study looked at creating intrauterine growth curve from two Mayan populations, the Tzutuhil and Kachiquel. These two Mayan populations while culturally distinct (language and customs) are separated by 14.5 Km and share many of the same obstetrical and socio-economic parameters.12 Therefore, the ultrasound data was combined to create the intrauterine growth curve presented here. The data set from the 2017 study, “Obstetric characteristics of two Mayan populations in the highlands of Guatemala” was obtained, with permission, from the author.12
This was a prospective longitudinal study that has been previously described from data collected between 2010 – 2013.12 Ultra-sonographers received initial training in obtaining the desired measurements and received ongoing mentoring on a weekly to monthly basis during the collection of the data. Measurements obtained included the biparietal diameter (BPD), head circumference (HC) femur length (FL), and abdominal circumference (AC). Crown Rump Length (CRL) was obtained for gestations less than 14 weeks. These measurements were obtained following known standards.14 Training included blinded measurements between the ultra-sonographer and mentor(s). Comparison of measurements were then revealed and ongoing training was provided, as needed, to arrive at comparable results.
Statistical analysis
Two sample t-test was used to test differences in continuous variables between all women compared to women in the final model, and chi-square tests were used to test for differences in categorical variables between all women compared to women in final model. Linear mixed effects model was generated using fetal measurements taken in late gestation, ie, after 14 weeks, utilizing repeated ultrasound measurements. Forward selection was used in model building. Four biometric measures were considered, along with additional maternal characteristics. Second-order terms for these variables were also tested. Mixed effect model building was performed using restricted maximum likelihood estimate. Likelihood ratio test was used to perform backwards selection using maximum likelihood estimate. Marginal and conditional residuals were generated for the linear mixed effects model. The growth curve was then compared to the NICHD gestational age estimation formula created by Skupski.10
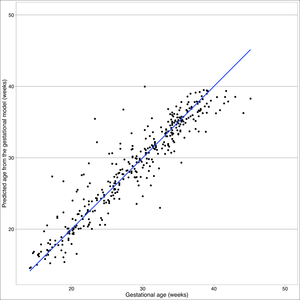
For late and early gestational models, we examined Q-Q plots to check the normality assumption and tested symmetry with kurtosis and skewness. Standardized residuals were examined to address the assumptions of linearity and constant variance. Outliers were identified using Cook’s distance with the 'mlt’ package (Katja Moehring & Alexander Schmidt, Boston, MA, USA). We characterized these outliers and their descriptive statistics. The late gestational model was rerun without the outliers to examine how the parameter estimates changed in the final model in the absence of these outliers. We also examined a plot of observed vs fitted values from this model. STATA /IC Version 15 was used for all analyses. Figures are generated in STATA (StataCorp, College Station, TX, USA) and R Version 3.4.1 (R Foundation for Statistical Computing, Vienna, Austria) using the same data, in addition to predicted values from both early and late gestational models. All predicted values used in R were calculated in STATA.
RESULTS
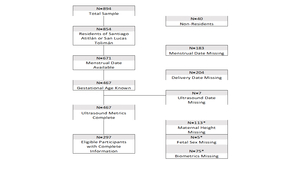
A total of 894 Guatemalan women enrolled in this study, with 460 of these women having known ultrasound biometrics. 113 were missing height, five were missing fetal sex, and 75 were missing biometric data. An additional eight women were excluded due to other missing covariates. In the final model, 289 women contributed 376 ultrasound measurements, where the average number of ultrasound visits was slightly more than one visit (see Figure 1). No statistically significant differences were observed for maternal height, birthweight, maternal BMI, and mean gestational age between the original sample and the final sample used in the model (P>0.05).
As of first visit, 73% of 894 women had complete ultrasound data and fell to 18% at second visit. In the final population, mean height was 1.49m (95% CI=1.48-1.49). No patterns of missingness exceeded 10% of all combinations of missing parameters. Crown rump length was only collected at 41 visits in early gestation. The linear model for early gestation explains 50.27% of the variation in gestational age in early gestation (F (1,39)=49.42, R^2=0.5027). In fitting the linear mixed effect model for late gestation, maternal characteristics including municipality, ethnicity, and height were not statistically significant, so these parameters did not dramatically improve the fit. No systematic patterns were observed in the, standard residuals for linear model, as well as for fixed or conditional effects in the late gestational model (online supplementary material Figures S1 & S2.). In the early gestation model, the skewness/kurtosis test for normality of residuals was not rejected, so we can conclude that they are normally distributed (P=0.654), see Box 1.
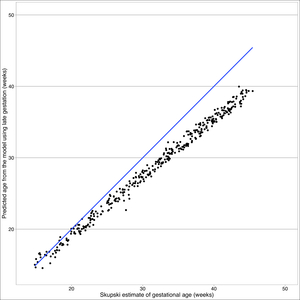
The Skupski model predicts lower values for gestational age than the final model (see Figure 4). The primary difference between these two models is femur length squared term absent in the final model. Starting at 32 weeks, there is a split in estimated gestational age, where Skupski predicts gestational age of 26 weeks, whereas this model predicts gestational age at 32 weeks.
In the late gestation model, we saw no systematic patterns in the standard residuals for linear mixed effect model, as well as for fixed or conditional effects (Figure S2 in the Online Supplementary Document). In the late gestation model, the skewness/kurtosis test for normality is rejected, so we see evidence that the errors are not symmetric due to the presence of the heavy tails or a handful of extreme outliers (P< 0.0001). We identified 18 participants with outliers using Cook’s Distance. Among these outliers, female participants were shorter than final sample at a height of 1.48 (±0.02), had slightly lower BMI of 26 (±1.24), approximately 50% had living children, 33% were multiparous, and 94% did not have a history of pre-term deliveries. Gestational age distribution of this population is largely pre-term (44%, <37 weeks) and post-term (22%). Outlier gestational age distribution differs from the age distribution seen in total sample and final sample, which observed most delivery ages between early and full term (37-<41 weeks). In a sensitivity analysis, deletion of outliers from 18 participants did not correct the normality violation detected by the skewness/kurtosis test (P=0.002). Yet, after deletion, Q-Q plots show no evidence of normality violation (Figure S3 in the Online Supplementary Document). Also, the regression terms for the best fitting linear mixed effect model after deletion are relatively unchanged from the final model (Figure S4 in the Online Supplementary Document).
DISCUSSION
Fetal growth is disproportionate for all populations (head larger than thorax/legs) and has been well described by the cephalocaudal gradient of growth. It has been postulated that this is secondary to the oxygen content in the fetal circulation. There is increased oxygen content to upper thorax, neck and head and less oxygen to the abdomen and legs.15
This makes sense teleologically in preservation of blood flow to vital organs, especially in times of stress. An example of this, is hypoxic stress to the fetus results in redistribution of blood flow to spare the myocardium, brain and adrenal glands, at the expense of most other organs.16
Our intrauterine growth curve begins to diverge at 32 weeks from the Skupski. It has been shown that Mayan children born in the USA have considerable increased leg length compared to Mayan children born in Guatemala.15 This appears to point to an environmental factor (nutritional, altitude, toxic exposure (wood burning) or other not identified risk factor.
This analysis indicates that for these Guatemalan populations that fetal ultrasound measurements and sex are appropriate in accurately predicting gestational age. World Health Organization advises that gestational age models developed in subpopulations may account for differences in maternal or child characteristics.17 Previously, race and ethnicity have been considered as a parameter in gestational age estimates, yet it was not to be statistically significant.10 The Tz’utujil and Kachiquel are very similar in both social and obstetrical characteristics and therefore it is reasonable to receive care based off the same gestational age estimate using ultrasound measurements.
In terms of limitations, there was large loss to follow-up towards the end of the study by visit 3 and 4, even by incentivizing the visit with a free ultrasound, which may result in a selection bias of participants. Additional social, environmental, and health-related variables were not measured at baseline, so alternative explanations for continued participation cannot be explored. The final limitation is that the source of differences in the fit between Skupski and final model was not identified.
The sensitivity analysis did not change our finding that the Skupski model is not transportable to the Guatemalan population. Due to the nature of data, it is not always possible to completely satisfy the normality assumption without trimming outliers, although this approach was not undertaken.18 Our sensitivity analysis gives us additional confidence in our model fit despite the presence of outliers that are responsible for our heavy tail.
In addition to self-selection and loss-to-follow-up, there is potential for information bias due to measurement error and reporting bias. Measurement error may arise to limited maintenance and calibration of instruments, despite technicians undergoing ongoing training throughout the study. Self-report data was used to ascertain previous history of pre-term birth. Due to stigmatization of miscarriages and adverse events during pregnancy, mothers in this study may be underreporting this clinical history.
CONCLUSIONS
The intrauterine growth curve generated from these two Mayan populations had notable divergence at later gestations from the Skupski curve. This difference may be related to a genetic predisposition that begins to be reflected in utero (average Guatemalan female in this study 1.49m, average USA female 1.62m.19 Selection bias could also explain these differences as those seeking obstetrical care or ultrasounds may have been at increased risk for perinatal /prenatal complications. It is plausible that environmental factors are associated with this divergence in the growth curve as previous studies have shown a discrepancy in leg length in newborn Mayan children born in the USA vs newborn Mayan children born in Guatemala. Application of this formula longitudinally and evaluation of confounding variables would help to verify these findings and provide further clarification for this possible difference. This formula, if validated, could help identify IUGR and provide the opportunity for timely intervention to decrease morbidity and mortality in this vulnerable indigenous population.
Funding: None.
Authorship contributions: AG: study design and statistical analysis. PS: study design and statistical analysis. BB: study design and data collection
Competing Interests: The authors completed the unified competing interest form at www.icmje.org/coi_disclosue.pdf (available upon request from the corresponding author) and declare no conflicts of interest.
Correspondence to:
Brent A. Burket, MD
Faculty / Director of Global Health Track
Rio Bravo Family Medicine Residency Program
A UCLA affiliated Family Medicine Residency
East Niles Community Health Center
7800 Niles Street
Bakersfield, CA 93306-4937
USA
[email protected]


