Globally, about 5.6 million under-five children die annually, and of these deaths, approximately 2.6 million, or 46% die in the first month of life, the neonatal period.1 This translates to approximately 7,000 newborns dying every day.1 Most of these deaths are preventable or treatable with access to proven, cost-effective interventions. The burden of neonatal and under-five deaths is unevenly distributed across regions and countries. For instance, almost 80% of global neonatal deaths occur in sub-Saharan Africa (37%) and the Southern Asian regions (39%).2 This distribution is mostly due to inequities in development.3 Reducing inequities that affect the most vulnerable under-five children are essential to achieving the Sustainable Development Goals target of reducing the under-five mortality rate to 25 or fewer deaths per 1000 live births by 2030.4
Myanmar is an ethnically diverse country in Southeast Asia, with a population of approximately 51 million.5 Within the last ten-years, the country emerged from a lengthy period of civil unrest resulting in inequalities and poor health status.6 In spite of the civil unrest and internal arm conflicts, Myanmar has made a substantial reduction in the under-five mortality rate from 116 deaths per 1000 live births in 1990 to 51 deaths in 2016.1 However, the country fell short of the two-thirds reduction target of the Millennium Development Goals and was rated second in Southeast Asian for under-five and infant mortality.7 Several underlying factors such as poverty, lack of access to clean fuels, safe drinking water, and inadequate sanitation facilities, may have contributed to the high mortality among under-five children.8
Several frameworks for understanding the complexity of child health and survival demonstrate a multifactorial cascade of events or pathways that include interactions between genetic, and environmental risks, and socio-economic health inequalities.9–11 For instance, under-five children who are exposed to poor environments, poor sociocultural practices, and poverty in early life are at increased risk of morbidity. In 2009 UNICEF developed a conceptual framework of the causes of maternal and newborn deaths.10 According to this framework, an interrelated factor at the societal level could influence underlying community and district level factors. In turn, these factors may have a detrimental effect on health through proximate level factors (such as household access to nutrition, water, sanitation, hygiene, and health-care services). Globally, neonatal, infant and under-five mortality account for over 90% of mortality for children under the age of 18, it is essential to understand the pathways to mortality.1 This is also important for Myanmar which is experiencing rapid economic growth and has an opportunity to intervene and improve under-five survival. Therefore, the study aimed to explore the intermediate and proximate causal factors associated with under-five mortality in order to help policymakers to implement appropriate interventions to prevent neonatal, infant and under-five deaths in Myanmar.
METHODS
Data sources
We examined data from the 2015-2016 Myanmar Demographic and Health Survey (MDHS) which is a stratified national level household survey conducted in seven States and eight Regions of Myanmar.12 The 2015-16 MDHS is the first ever Demographic and Health Survey conducted by the Myanmar Ministry of Health and Sports and funded by the United States Agency for International Development. The main objective of the 2015-16 MDHS was to provide up-to-date estimates of basic demographic and health indicators to assist policymakers and program managers in evaluating and designing programs and strategies for improving the health of the population.
The 2015-16 MDHS constitute three sets of questionnaires household, woman and man. The household questionnaire listed all the usual household members and recorded socio-demographic information such as age, sex, education, relationship to the head of the household and other information on the household’s dwelling characteristics. The woman’s questionnaire collects information from all women aged 15-49 and includes women’s demographic characteristics, information on reproductive history, including their full birth history, and survival of their live-born infants. The man’s questionnaire collects demographic characteristics and their reproductive history.
A two-stage stratified sampling design was conducted for the selection of the sample in urban and rural areas, and for each of the seven States and eight Regions of Myanmar. The first stage involved selecting sample points (clusters) consisting of enumeration areas (EAs) or ward/village tracts with a total of 442 clusters (123 urban and 319 rural). At the second stage, equal probability systematic sampling was used for selection of a fixed number of 30 households from each of the selected clusters. A total 12,500 households with 98% response rate were successfully interviewed from a selected number of 13,238 households. Among the 13,454 of the eligible women, 12,885 were interviewed, yielding a 96% response. The detailed information of the 2015-16 MDHS sampling design have been reported elsewhere.12
Conceptual framework
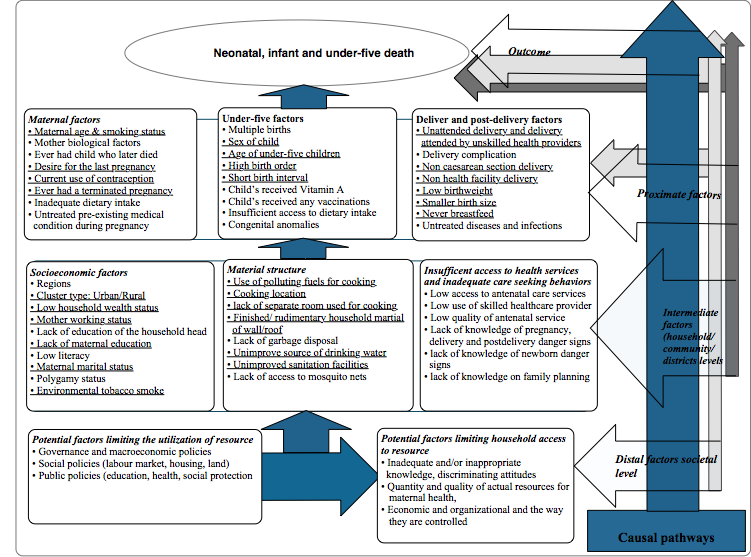
Due to the limited nature of the cross-sectional data to measure the direct upstream casual effect of the factors associated with child mortality we modified a conceptual framework developed by UNICEF10 and the WHO11 using existing literature as a guide to explore the potential causal pathways of child mortality. According to the framework (Figure 1) the blue arrows representing a direct causal pathway such as the causal effect of maternal factors, under-five child factors, and birth and post-birth factors on under-five mortality. The light gray and dark gray arrows show complex indirect multifactorial causal pathways of the societal level factors, and household and community level factors on child mortality. Using this framework of child mortality, there are several interrelated factors associated with child mortality at the societal level such as Government, macroeconomic policy, social and public policies. These societal level factors may directly or indirectly affect the intermediate and proximate level factors such as household characteristics. In turn, the household socioeconomic status, such as wealth, income and education, may directly or indirectly influence the most proximate factors such as maternal and child factors. Using the available information from the 2015-16 MDHS, we identified 27 potentially causal factors of under-five mortality in Myanmar.

Study variables
The primary outcomes for these analyses were neonatal, infant and under-five mortality recorded as a binary variable (0 for living child and 1 for a child death). We conducted three separate models for each of the outcome variables. We defined neonatal mortality as the probability of dying in the first month of life (0-28 days), infant mortality as the probability of dying between birth and the first birthday (0-11 months) and under-five mortality as the death of a child under the age of 5 years (0-59 months). We estimated the neonatal, infant and under-five mortality rate directly from the birth history record (child’s date of birth, date of interview and age at death). Data were obtained from the birth history section of the questionnaire administered to mothers aged 15-49 who had given birth during the five-year period prior to the survey. For these analyses, we calculated the child mortality rate for each age period (neonatal, infant and under-five) as the number of deaths per 1000 live births in a given year. Multiple pregnancies (n = 86) were excluded from the analysis because of the higher risk of newborn death associated with preterm birth and pregnancy complications among this group compared with singleton pregnancies.13
In these analyses, potential confounders were categorised based on the conceptual framework. The intermediate causal factors describing the characteristics of the household, community and district level factors was subdivided into socio-economic factors (location of household, household wealth status, mother’s education, mother’s working status, and maternal marital status); and material structure of household (main household material of the wall and roof, cooking location, separate room for cooking, type of cooking fuel, household access to improved sanitation facility and improved source of drinking water and environmental tobacco smoke). The proximate causal factors describing individual level circumstances were further categorised into maternal factors (mother’s current age, current use of contraception method, ever had a terminated pregnancy and mother smoking status); child factors (sex of child, age of child, birth rank and interval); and birth and post-birth factors (birth assistance, mode of delivery, breastfeeding status, and child birthweight and birth size). The list of the variable definitions with their categorisation can be found in Table S1 in Online Supplementary Document(Online Supplementary Document).
Statistical analysis
Frequency tabulations were generated to describe the selected characteristics of study variables.14 Neonatal, infant and under-five mortality rates were calculated by using a method similar to that described by Rutstien and Rojas.15 This was followed by conducting binomial and multivariate logistic regression for each of the outcome variables (neonatal, infant and under-five mortality) that was adjusted for cluster and survey weights.
In the multivariate logistic regression analyses, a four-stage hierarchical model described by Victora et al was performed for each of the outcome variables.9 According to this approach, the effect of distal variables should be examined without improper adjustment by proximate or intermediate variables. In model one, all the intermediate socio-economic factors were entered. A manually executed backward elimination method was conducted to determine factors associated with each outcome and those significant (P < 0.05) were retained. In the next model, we added the material structure level factors of the house, and this was followed by a backward elimination procedure but retaining all the significant factors from model one. A similar approach was used in each model. The final model included all the variables with P<0.05 from model-three, model-two and model-one. We reported the variables with a statistical significance of P < 0.05 in each model, and we tested the variables for any collinearity. All analyses were carried out using STATA/MP version 12 (Stata Corp, College Station, TX, USA). The ‘Svy’ survey commands were used to allow for adjustments for the cluster sampling design and sampling weights.
RESULTS
The study population consisted of 4,726 (4198 weighted) singleton live born neonatal, infant and under five children. The total number of under-five deaths was 162 with an estimated neonatal mortality rate of 20 per 1000 live births, a postneonatal mortality rate of 15 per 1000 live births, an infant mortality rate of 35 per 1000 live births, a child mortality rate of 9 per 1000 live births and under-five mortality rate of 45 per 1000 live births.
We found differences in the distribution of the baseline characteristics with approximately, 78% of the study population living in a rural area and over 50% of those in the lower wealth quintiles. More than 82% of households used polluting fuels as their primary source of fuel, with wood (64%) as the most common type of fuel. About 63% of households cooked in the house, and 60% did not have a separate room used for cooking. Exposure to environmental tobacco smoke was very common in Myanmar with 59% of women reporting that a household member smoked inside their house. The majority of the study population (64%) gave birth in a non-health facility, and 34% of those births were either not attended or attended by unskilled healthcare providers. A higher mortality rate of over 340 deaths per 1000 live births was observed among 3% of children who were never breastfeed. About 50% of under-five children were not weighed at birth, and those children were more likely to be deceased, 63 deaths per 1000 live births. Overall, children born to: mothers with no education, mothers who smoked, or mothers aged 40 years and over experienced a higher rate of under-five mortality (Table 1).
In the multivariate analysis, the material structure of the house in which the children were born into and post-delivery practices were highly associated with neonatal mortality. For instance, children born to a household with a natural material for the roof (AOR=4.22, 95% CI=1.36 to 13.0) and rudimentary material of the roof (AOR=3.24, 95% CI=1.31 to 8.01), had a higher odds of death compared to those children born to a household with a finished material used for the roof. Smaller than average size children are three times more likely to die during the neonatal period (AOR=3.33, 95% CI=1.44 to 7.68) than those with average and larger than average size. Furthermore, newborn unweighed at birth had a higher odds of death (AOR=4.16, 95% CI=01.58 to 11.00) compared to those weighed at birth (Table 2).
In the multivariate analysis, we found that socio-economic factors such as household wealth, maternal education and maternal working status were risk factors for infant and under-five survival. For instance, children born to households in the lowest wealth quintile experienced a higher odds of death, greater than two-fold for infants (AOR=2.82, 95% CI=1.28 to 6.20) and greater than three-fold for all under-five children (AOR=3.83, 95% CI=1.76 to 8.32) than those children born to a household in a higher wealth quintile. A shorter birth interval of < 3 years between birth and second births was highly associated with infant and under-five deaths. For both infant and under-five, it was a two-fold risk, infant (AOR=2.26, 95% CI=1.31 to 3.89) and under-five (AOR=2.02, 95% CI=1.10 to 3.70) compared to those born with a birth interval >3 years. In this analysis, normal vaginal birth was highly associated with infant and under-five death in comparison to caesarean section birth (Table 3 and Table 4).
Children born to mothers aged 40 years or more were three times more likely to die (AOR=3.12, 95% CI=1.59 to 6.12) than those children born to mothers aged <40 years. Across all the age ranges (Tables 2, Table 3, Table 4), never breastfeed children experienced higher odds of death (AOR=36.34, 95% CI=17.58 to 75.12) neonatal, (AOR=23.13, 95% CI=12.32 to 43.41] infant and (AOR=29.1, 95% CI=14.44 to 58.67) for under-five mortality than breastfeed children.
DISCUSSION
This study examines the potential causal pathways associated with the intermediate and proximate level factors on neonatal, infant and under-five mortality. We found higher rates of neonatal, infant and under-five mortality were related to lower socio-economic position of the household which in turn impacted maternal and child factors. Our study findings highlight the need for interventions targeting population sub-groups such as poorer households and rural and remote populations and addressing the barriers of accessing family planning and social services.
Distal level societal factors such as economic development and poverty reduction has a positive effect on improving population health particularly child health outcomes.16 Low income is associated with higher rates of infant and under-five mortality similarly to our findings.16–18 For instance, in Myanmar under-five children from the lowest wealth quintile household experienced a higher rate of death compared to their counterparts from the highest wealth quintiles. Poorer households are likely to account for a large proportion of the population living in rural and remote locations characterised by inadequate housing infrastructure.8 Also, these households lack access to improved drinking water and sanitation facilities, putting them at higher risk of death before their fifth birthday.12 Therefore, countrywide socio-economic development accompanied with the nation’s high level of political commitment to health development is one of the essential steps to achieve the Sustainable Development Goal 3.
Studies from low and middle-income counties indicate that poor housing and or household income affects the social and physical conditions of an individual’s well-being.19–21 In this study neonates born to parents living in poor housing conditions such as a house with no wall, or a wall material made of cane, palm, trunks, leaves and dirt experienced higher odds of death than those children living in house made from rudimentary and finished material of the wall such as cement, or bricks (see Table S1 in the online supplementary document(Online Supplementary Document)). According to 2014 Myanmar Census report under five children living in such households were also exposed to other environmental health threats such as use of solid fuels for cooking (94%) which increases their risk of respiratory disease and burns.22 Therefore, improving the standard of living conditions such as infrastructure specifically for rural and remote areas is essential to achieve substantial reductions in neonatal mortality in Myanmar by 2030.
In this analysis, the intermediate socio-economic factors such as maternal employment was associated with infant and under-five death. Studies from Kenya, India, and Pakistan reported a higher rate of under-five mortality among mother’s working in agriculture sector compared to non-working mothers.23–25 In this analysis the causal pathway between maternal current working status and infant and under-five death is unclear. However, a possible explanation could be due to mothers whose newborn died are more likely to return to work sooner than their counterpart; alternatively, women from poorer households may return to work early in order to generate income to support their family. Therefore, further research is required to investigate this association.
Maternal education is one of the well-known factors to predict under-five mortality and it is a measure of the socioeconomic position of the individual women but also in the society.26 Several studies have reported an association between higher death rates among under-five children born to mothers with no education as was found in this study.27,28 For instance, in Myanmar, about 53% of mothers with no education are from the poorest households and their children are more likely to die before reaching their fifth birthday. Since educational attainment is associated with wealth, implementing interventions to enhance the learning opportunities for adolescent girls and women and finding solutions to access education is essential for improving the survival of their offspring.
Proximate biological characteristics of newborns such as birth weight and birth size are recognised as relevant factors for early neonatal and infant death and are highly correlated with maternal factors and antenatal care.29,30 In this analysis, children with low birth weight (<2500 g) and those unweighed at birth, and smaller than average size showed an increased risk of neonatal and infant death. According to 2015-16 MDHS report, several determinants related to maternal factors such maternal stature, nutritional status, pre-existing pregnancy conditions, infection and access to maternity care services could potentially affect fetal and child growth and development.12 Therefore, ensuring essential integrated services with particular emphasis for reducing low birth weight children is essential for improving neonatal and infant survival.
Several studies have shown that short birth interval (< 3 years) influences the probability of infant and under-five survival similarly to our finding.31,32 For instance in El Salvador shorter birth intervals were a contributing factor for early breastmilk weaning or inadequate complementary feeding practices.33 In Myanmar, there is a substantial proportion of married women who want to delay their pregnancy or limit the number of pregnancies (61%), and another 18% report an unmet need for family planning.12 Therefore, improving family planning service access is needed to avoid the risks associated with short birth intervals, unwanted pregnancy, and ultimately, reduce child deaths.
In this analysis, the proximate birth and post-birth factors such as never breastfeed children and children delivered via vaginal birth are four times more likely to die during the neonatal, infant periods or before reaching their fifth birthday. This is likely explained by the high proportion of neonatal deaths which account for half of all under-five deaths. The risk of vaginal birth is more likely due to poor access to a caesarean section in rural regions, and the risk of death among never breastfeed children could at least be partly related to those deaths that occurred very early and did not get a chance to breastfeed. Therefore, increasing funds to hospitals that can be used to improve access for poor mothers and children or those living in hard-to-reach villages34 such as to cover transportation costs, or daily allowances, or hospital delivery and medical care costs could be a possible solution to overcome high neonatal, infant and under-five mortality in Myanmar.
The study strengths include a representative national sample with a high response at the household (98%) and individual levels for women (96%) and men (91%) and appropriate adjustments in the analysis for the sampling design. To minimise potential maternal recall bias and errors, data on birth history were collected for the five years prior to the survey. There are several limitations to the DHS data that are relevant to this study. Firstly, this data is cross-sectional and thus restricts the interpretation of causality. We, therefore, based our analysis on factors that had been identified in a previously published conceptual model.10,11 Secondly, the reliance on maternal recall for the data is also a weakness however it is unlikely there would be response bias that would affect this analysis. Further, there are many important variables that are not collected such as known biological determinants of mortality; however, these data are the best nationally representative data available from Myanmar.
CONCLUSION
This study illustrates the indirect causal association between socio-economic position of the household, maternal factors and child factors on neonatal, infant and under-five deaths. In Myanmar infant and under-five mortality is strongly related to poverty therefore, effective strategies that target the poor population, such as improving the infrastructure of the household, and access to improve drinking water and sanitation facilities is essential for improving under-five survival by 2030. Importantly high neonatal and infant mortality among low birth weight, smaller than average birth size and never breastfeed children is mostly preventable with timely access to essential newborn care services. In order to help women and adolescent girls achieve a healthy reproductive life improved access to education, and reproductive health services is essential.
Disclaimer
The author’s state that the views expressed in the submitted article are his or her own and not an official position of the institution or funder.
Ethical approval consent
The Ethics Review Committee on Medical Research including Human Subjects in the Department of Medical Research, Ministry of Health and Sports and ICF Institutional Review Board reviewed and approved the survey protocol. A verbal informed consent was taken from each respondent before the interview. The Demographic Health Survey program gave permission of access and the use of the data for this research.
Funding
CRG and NSM acknowledge the NHMRC CDF # 1087062, and the University of Sydney, SOAR funding.
Competing interests
The authors completed the Unified Competing Interest form at http://www.icmje.org/coi_disclosure.pdf (available upon request from the corresponding author) and declare no conflicts of interest.
Correspondence to:
Ngatho Samuel Mugo
Sydney School of Public Health
Faculty of Medicine and Health
Edward Ford Building (A27)
University of Sydney NSW 2006
Australia
[email protected]