Newborns face the highest risk of dying during the neonatal period – first 28 days of life, at a rate of 19 deaths per 1,000 live births.1,2 Neonatal mortality accounts for 46% of all under-five mortality with most deaths occurring in low- and middle-income countries.1,2 Globally, 2.6 million babies died before turning one month old in 2016, with about 50 per cent of these deaths occurring in the first day of life and 75 per cent in the first week of life.1,2 The overall progress in reducing neonatal mortality rates has been slower than that reported in under-five mortality; while neonatal mortality declined by 49 per cent from 1990 to 2016, the under-five mortality rate declined by 62 per cent within the same period.1,2 Though the global neonatal mortality rate has decreased from 37 deaths per 1,000 live births in 1990 to 19 in 2016, the rate is still unacceptably high in certain regions and countries around the world.1,2
Sub-Saharan Africa (SSA) is one of the regions with the highest prevalence of neonatal mortality (38 per cent) with some degree of variation across its countries and only minor declines over the last two decades.3–5 Within SSA, neonatal mortality rate is unevenly distributed and countries in the Great Lakes region (Burundi, Democratic Republic of Congo (DRC), Kenya, Rwanda, Tanzania and Uganda) contribute to this burden due to decades of political instability, conflicts, poor quality of healthcare governance, inadequate health financing and human health resources, low standard health service delivery, and poor socioeconomic status.6,7
The causes of neonatal mortality are well-known which include: preterm birth complications, intrapartum-related complications, birth asphyxia, congenital anomalies and infections such as neonatal sepsis, tetanus, meningitis and pneumonia.1,2 These causes are often exacerbated by underlying determinants which could be related to the environment of the newborn – whether it is an impoverished family, a marginalized community or a country consumed by conflict. These underlying determinants operate as socioeconomic factors, maternal lifestyle factors, health service factors and environmental factors which could be mitigated through a system-wide approach that strengthens the health systems to provide quality health care. Studies have shown that a vast majority of neonatal deaths are preventable through improved access to good quality maternal and newborn health services delivered by skilled health professionals, clean water supply, proper antenatal and postnatal nutrition for mother and newborn, disinfectants and skin-to-skin contact.1,8–10 However, in resource-limited countries experiencing prolonged periods of conflict and political instability like those located in the Great African Lakes region, the need for interventions that target the most significant underlying factors is essential to assist in proper planning and strategic allocation of scarce resources. Hence, the aim of this study was to ascertain the most significant factors associated with neonatal mortality across countries in the Africa Great Lakes region in order to assist in national and regional policy prioritization. Findings from this study will contribute to the existing body of evidence buttressing the need for improved quality of health service in tackling the problem of neonatal mortality and also assist in the planning and evaluation of health policies and programmes.
METHODS
This study used datasets from the most recent Demographic and Health Survey (DHS) conducted in all six countries of the African Great Lakes region (Burundi, DRC, Kenya, Rwanda, Tanzania and Uganda). The DHS is a population-based, nationally representative household survey which collects data on maternal and child health, gender, fertility, HIV/AIDS, malaria, family planning and nutrition in developing countries. The DHS programme adopts standardized methods involving uniform questionnaires, manuals, and field procedures to gather information that is comparable across countries. The surveys employ a stratified, multi-stage (cluster), random sampling design and is conducted about every 5 years, to allow comparisons over time. Information was obtained from eligible women aged 15-49 years in each country. The survey uses verbal autopsy questionnaire to collect data for neonatal deaths. Detailed survey methodology and sampling methods used in gathering the data have been reported elsewhere.11–16
A pooled analysis was conducted to determine the significant factors associated with neonatal mortality across the Great Lakes region. However, Kenya was excluded from the multilevel modelling due to the large number of missing values in the dataset. The analyses were restricted to most recent singleton live births reported in the 5 years preceding the surveys in order to minimise recall bias by the mothers, thus strengthening the internal and external validity of this study. Furthermore, singleton selection eliminated any confounding effect of multiple births that are prone to mortality due to biological factors.
Outcome measure
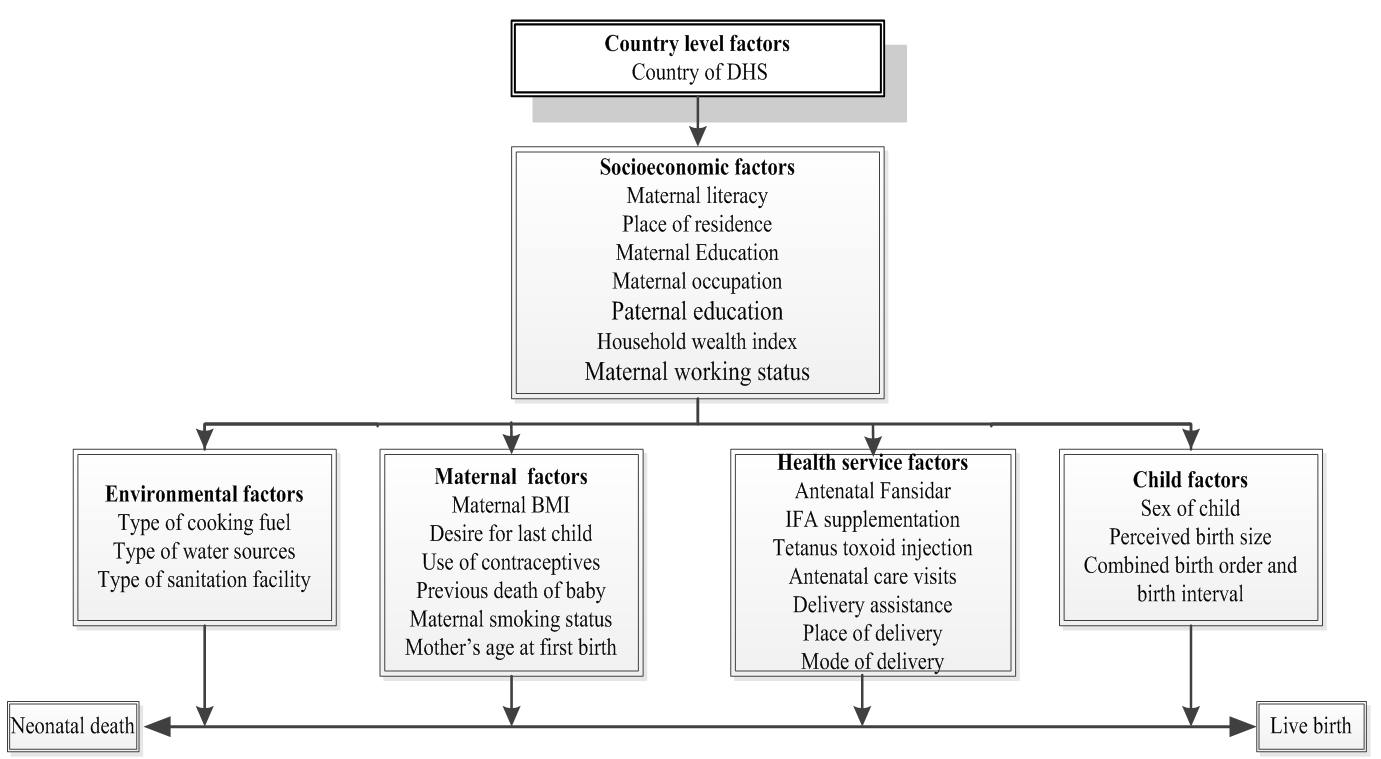
The main outcome measure for this study was neonatal mortality which refers to the death of a newborn within the first 28 days of life.1 The study outcome was reported as a binary variable with ‘Neonatal death’ coded as 1 and ‘Live birth’ coded as 0. A birth history was used to estimate neonatal mortality in all the individual country DHS.
Study independent variables
The study independent variables used in this analysis were classified based on Mosley and Chen conceptual framework of factors influencing child survival in developing countries.17 These variables were adapted to the data available in the merged dataset and were categorized as: country level factors, socioeconomic factors, maternal factors, child factors, environmental factors and health service factors as shown in figure 1. The country level factors were the country of survey which includes Burundi, DRC, Kenya, Rwanda, Tanzania and Uganda. Socioeconomic factors were maternal literacy, place of residence, maternal education, maternal occupation, paternal education, household wealth index and maternal working status. The household wealth index serves as an indicator of the economic status of the household which is consistent with household assets, income and expenditure measures. The household assets and facilities used in calculating this index include television (TV), refrigerator, bicycle, radio, motorcycle, car, electricity, type of toilet facility and type of building materials used in the place of dwelling. The index was represented as a score of household assets via the principle components analysis (PCA) method.18 In the DHS data set, the household wealth index was categorised into five quintiles: poorest, poorer, middle, richer and richest. However, in this analysis, the household wealth index was re-categorised into three groups: the bottom 40% of households were referred to as poor households, the next 40% as middle households and the top 20% as rich households. Maternal factors were maternal body mass index (BMI), desire for last child, use of contraceptives, previous death of baby, maternal smoking status and mothers’ age at first birth. Child factors were sex of child, perceived birth size, combined birth order and birth interval. Environmental factors were type of cooking fuel, type of water sources and type of sanitation facility. Type of cooking fuel was categorized into solid fuel and non-solid fuel. Solid fuels included (i) traditional biomass (wood, charcoal, agricultural residues, and dung), (ii) processed biomass (pellets, briquettes); and (iii) other solid fuels (such as coal and lignite). Non-solid fuels included (i) liquid fuels (kerosene, ethanol, or other biofuels), (ii) gaseous fuels (natural gas, liquefied petroleum gas, and biogas), and (iii) electricity.19 Type of water sources and type of sanitation facility were classified based on the World Health Organization (WHO) and United Nations Children’s Fund (UNICEF) Joint Monitoring Program (JMP) guidelines.20 Based on these guidelines, water sources were categorized into (i) improved sources which include piped water in a dwelling, plot or yard, public taps or standpipes, tube wells or boreholes, protected dug wells, protected springs and rainwater collection. (ii) Unimproved sources were unprotected dug well, unprotected spring, cart with small tank/drum, tanker truck, bottled water and surface water (river, dam, lake, pond, canal, irrigation channels and stream). Sanitation facility was categorized into (i) improved facility which include households with flush toilet, ventilated or improved pit latrine, pit latrine with slab and composting toilet). (ii) Unimproved facility included traditional pit toilet, pit latrine without slab or open pit and bucket toilet and open defecation (bush or field for defecation). Health service factors were antenatal Fansidar, antenatal iron-folic acid (IFA) supplementation, tetanus toxoid (TT) injection, antenatal care (ANC) visits, delivery assistance, place of delivery, mode of delivery, postnatal check-up and timing of postnatal check-up. However, postnatal check-up and timing of postnatal check-up were not included in the multilevel analysis because they reported a large number of missing values.

Data analysis
All statistical analyses were conducted using STATA statistical software, version 14.1 (Stata Corporation, College Station, TX, USA) with ‘Svy’ commands to adjust for cluster sampling survey design, weights and standard errors (SEs). The neonatal mortality rate and 95% confidence interval (CI) was estimated using the number of resident newborns dying at less than 28 days of age divided by the number of resident live births multiplied by 1,000.
The Cox proportional hazard regression model was used to independently assess the effect of the study variables on the outcome measure (neonatal mortality) after adjusting for potential confounding variables. A pooled analysis was conducted to increase the number of reported deaths in the region. The multivariable analysis used a six staged conceptual model as shown in figure 1. A stepwise backward elimination process was performed at each stage and factors significantly associated with the study outcome were retained. To avoid any statistical bias, we double checked our results by1: entering only potential risk factors with a P-value < 0.20 obtained in the univariable analysis for backward elimination process,2 testing the backward elimination method by including all of the variables (all potential risk factors),3 and testing and reporting any collinearity in the final model. The hazard ratios (HRs) and their 95% CIs were used to estimate the adjusted risk of the study variables and those with P < 0.05 were retained in the final model.
RESULTS
Characteristics of study variables
Table 1 shows the number of children and their corresponding percentage in each country, as well as the distribution of the study variables in the African Great Lakes region. A total sample of 56600 children were reported across the region. Burundi, DRC, Kenya, Rwanda, Tanzania and Uganda reported 8776 (16%), 10815 (19%), 14189 (25%), 5963 (11%), 6920 (12%) and 9936 (18%) children and their percentage respectively. A weighted total of 866 most recent neonatal deaths occurred within the 5 years’ period preceding the survey in the region. Of which DRC reported 208 deaths, Kenya reported 191 deaths, while Uganda, Tanzania, Burundi and Rwanda reported 181, 113, 95 and 77 deaths respectively.
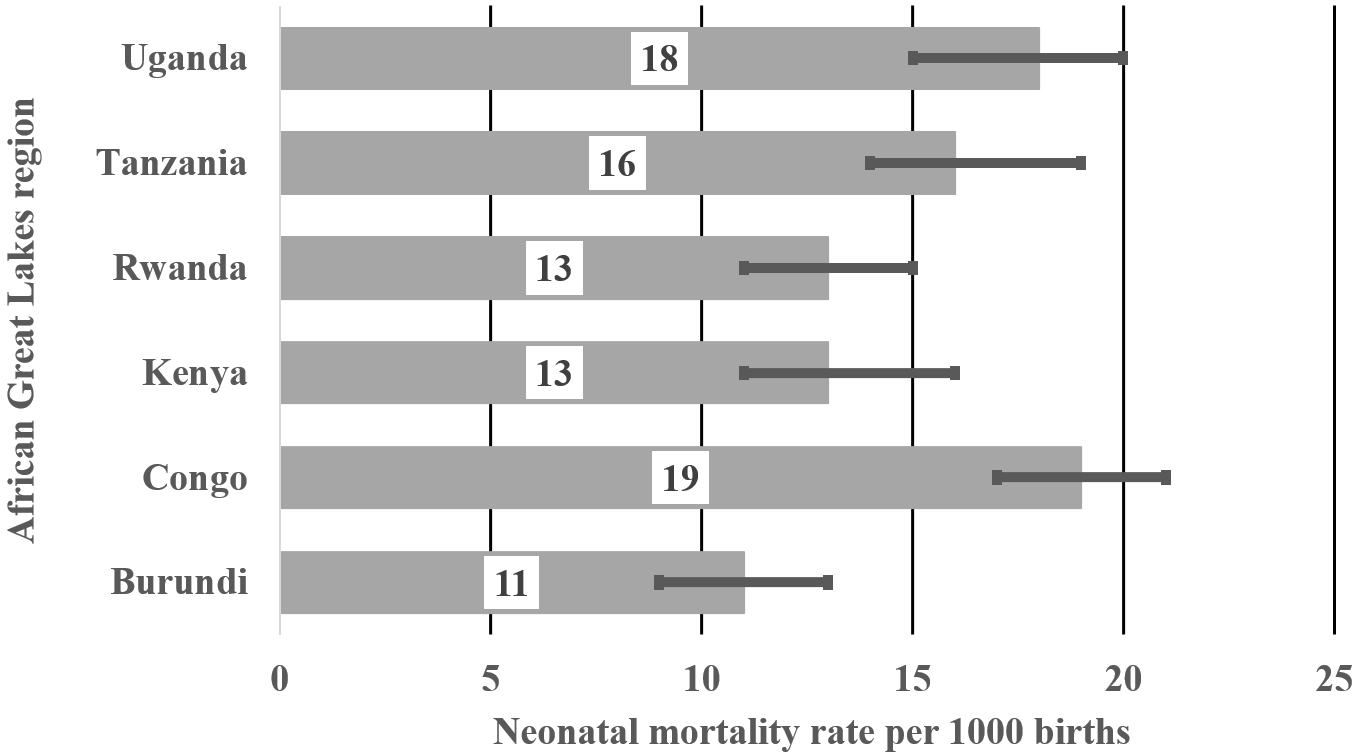
Figure 2 shows neonatal mortality rate per 1000 births for countries in the African Great Lakes region. Three countries reported significantly higher rates than the rest of the region, notably DRC (19; 95% CI=17-21), Uganda (18; 95% CI=16-21) and Tanzania (16; 95% CI=14-19). Compared to DRC, neonatal mortality rate was significantly lower in Burundi (11, 95% CI=9-13), Rwanda (13, 95% CI=11-15) and Kenya (13, 95% CI=11-16).

Table 2 reports the neonatal mortality rates and their 95% CIs by study variable within each country in the African Great Lakes region. Neonatal mortality rate was significantly higher across all countries for mothers who had a caesarean section, did not have antenatal care visits, and reported previous death of a baby as well as for babies who were perceived as smaller than average size. The rate was also significantly higher among women not using contraceptives in all the countries except Burundi and in mothers who are smokers compared to non-smokers in DRC, Kenya and Tanzania. Likewise, the neonatal mortality rate was significantly higher among male children than their female counterpart in Burundi, Rwanda, Tanzania and Uganda. In DRC, Tanzania and Uganda, neonatal mortality rate was reported to be significantly higher among women that use solid fuels for cooking and among women who drank water from unimproved water sources. Furthermore, neonatal mortality rate was significantly higher in households using unimproved sanitation facility in Kenya and Uganda, and also among mothers who did not have TT injection than among mothers who had 2+ TT vaccines in DRC, Kenya and Uganda. Neonatal mortality rate was significantly higher among mothers who did not have antenatal Fansidar and antenatal IFA supplementation in Tanzania and Uganda and was higher across all countries for mothers who had caesarean section.
Factors associated with neonatal mortality
Table 3 shows the unadjusted and adjusted Hazard Ratios (HR) and 95% CI for factors associated with neonatal mortality in the African Great Lakes region. The risk of NMR was significantly higher in DRC compared to Burundi. However, it is important to note that the risk of NMR in Tanzania relative to Burundi approached statistical significance (P=0.066) in being higher.
In the multivariate analysis, children born in DRC (HR=1.41, 95% CI=1.04-1.92) were more susceptible to neonatal deaths than those born in other countries within the region. Mothers not using contraceptives (HR=1.81, 95% CI=1.43-2.29) were more prone to having neonatal deaths compared with mothers who were using contraceptives. Mothers who reported previous death of a baby (HR=10.3, 95% CI=7.75-13.68) were more likely to have neonatal deaths. Male children (HR=0.79, 95% CI=0.65-0.96) were more predisposed to neonatal deaths than their female counterpart. Newborns that were perceived as smaller than average were more susceptible to neonatal death (HR=1.88, 95% CI=1.47-2.39). Women who reported having the first child had higher risk of neonatal mortality (HR=3.05, 95% CI=2.28-4.07); whereas, women with 4th or more child with >2 years birth interval had a significantly lower risk of neonatal mortality (HR=0.48, 95% CI=0.36-0.66). Mothers who did not receive any TT injections (HR=1.36, 95% CI=1.04-1.78) and mothers who received one dose of TT injection (HR=1.27, 95% CI=1.00-1.61) were more susceptible to neonatal death than mothers who received 2+ doses of TT injection. Mothers who had no antenatal care visits during pregnancy were more likely to have neonatal deaths HR=1.62, 95% CI=1.06-2.48) compared to mothers who had 4+ antenatal care visits. Women who delivered by caesarean section (HR=1.89, 95% CI=1.40-2.55) were more predisposed to neonatal death than women who had a non-caesarean section delivery.
DISCUSSION
This study examined the rates of, and predisposing factors associated with neonatal mortality across the African Great Lakes region. DRC reported the highest rate of neonatal mortality in the sub-region. DRC is one of 25 priority countries for United States Agency for International Development’s (USAID) work in improving child health as a result of the high rates of newborn deaths.2 DRC has suffered from war and prolonged conflicts which led to massive disruption to the political, social and economic structure of the country thereby negatively affecting the logistics of food distribution, sanitation, and the delivery of and access to health services.21 USAID has stated that a scale-up of known and proven high-impact interventions could save the lives of more than 1.5 million children by 2020.2 However, this can only be achieved by strengthening the health system and its utilization in the country.
We found that neonatal mortality rate was significantly higher among male newborn compared to female newborns. Female neonates have a biological advantage in survival over their male counterparts. This could be due to slower lung maturation among male fetuses which leads to a higher incidence of respiratory distress syndrome in male newborns compared with female newborns.22 Globally, it is estimated that approximately 23% of newborn deaths are attributed to respiratory problems.23 Studies have shown that male newborns are more vulnerable to congenital anomalies, infectious diseases such as intestinal infections and lower respiratory infections, as well as perinatal conditions such as birth trauma, fetal macrosomia, intrauterine hypoxia, birth asphyxia, gestational diabetes, prematurity, respiratory distress syndrome and neonatal tetanus.24–27 However, the underlying mechanisms contributing to the observed male disadvantage are still unknown.
In our study, babies who were perceived as being small or as having low birthweight (LBW) by their mothers recorded higher neonatal mortality than larger babies. Studies have shown that LBW contributes to 60% to 80% of all neonatal deaths and it is inversely proportional to neonatal mortality.1,28 LBW primarily results from premature birth (being born before 37 weeks gestation) or from intrauterine growth restriction (IUGR) (baby not growing well in utero).28,29 Prematurity and its consequences contribute to an estimated 50% of neonatal deaths.30 Preterm newborns have greater susceptibility to respiratory distress, jaundice, infections, temperature instability, kernicterus, hypoglycemia, seizures, necrotizing enterocolitis, and periventricular leukomalacia.31 Prevention of preterm births is one of the best ways to prevent babies born with low birthweight. However, in communities were preterm births and low-birth-weight are evident, home-based neonatal care could provide essential postnatal care to mothers as a complementary strategy to facility-based postnatal care. Home-based neonatal care enables continuous coverage of care and improves newborn survival especially for mothers who are unable to access it due to financial, social and physical barriers.32 This care could include home visits in the first month after birth with a focus on promoting essential newborn care practices such as early initiation of breastfeeding and exclusive breastfeeding, screening of high-risk neonates, promoting of hygienic umbilical cord and skin care, management of sepsis, referral of sick infants to health facilities as well as providing of information to mothers on danger sign recognition and skin-to-skin thermal care. In addition, WHO and UNICEF recommends home visits in the first week of life to improve newborn survival.32
We found that the first child has an increased likelihood of neonatal mortality. This may be as a result of the first child being born to a young mother due to teenage marriage.33 Based on UNICEF’s 2017 report, the proportion of teenage marriages in Uganda, DRC and Tanzania was 40%, 37% and 31% respectively, while in Kenya, Burundi and Rwanda it was 23%, 20% and 7% respectively.33 The mother’s age at birth is important for the quality of decisions she makes. Studies have shown that young maternal age is associated with many health-related complications which arise not only from biological and medical causes but also from underlying sociocultural influences such as lack of education, limited autonomy to make decisions due to family pressure, poor health-seeking behaviours as well as non-usage of available health services and infrequent routine antenatal and postnatal check-ups.34–36 On the other hand, this study also reported that children of 4th or higher birth order with long birth intervals (>2 years) were more prone to neonatal mortality. Children of 4th or higher birth order with long birth intervals (>2 years) are likely to be born to older women and research has shown that advanced maternal age is significantly associated with pregnancy complications such as preterm birth which is a direct cause of neonatal mortality.30,31,37
Findings from this study show that a mother’s report of a previous death of baby was significantly associated with a neonatal death. Studies have shown that the probabilities of neonatal death among second children were highest among mothers whose first child also died during the neonatal period.38,39 Birth spacing and maternal age at time of birth are important determinants for the survival of newborns.38 Hence, healthy timing and spacing of pregnancy are effective low-cost prevention approach for reducing neonatal mortality especially in the African Great Lakes region.40,41
The use of contraceptives could have important effects on child survival. In this study, women not using contraceptives were reported to be more predisposed to neonatal mortality. Studies have shown that non-usage of contraceptives exposes women to unintended pregnancies which lead to poor health-seeking behaviours and negligence.34 The positive impact of contraceptive use is evident when it assists reproductive age women prevent closely spaced births. Strategies to reduce neonatal mortality rates by empowering women to control the timing of their births using modern contraceptive methods have great health benefits for mother and neonate.42,43 By improving access to and use of family planning methods such as contraceptives use, women can reduce closely spaced births and limit childbearing to their 20s and 30s, thereby reducing their chances of neonatal mortality.42 Therefore, there is a need for governments and non-governmental organizations that are concerned about the level of neonatal mortality to promote and fund family planning services and contraceptive supplies especially in communities of low socioeconomic status.
This study reported a higher likelihood of neonatal mortality among mothers who delivered by caesarean section compared with vaginal deliveries. This could be attributed to the effect of life-threatening pregnancy complications which warrant for emergency caesarean section or iatrogenic prematurity.44 However, contrary to our findings is a cross-sectional, ecological study which reported caesarean delivery rates were inversely correlated with neonatal mortality,45 and another ecological study which also reported that caesarean section available for high-risk pregnancies could contribute to improve neonatal outcomes.46
Reproductive health care is the care given to a woman across her reproductive life related to reproduction from pre-conception to pregnancy, delivery, and post-delivery. This care is important for the survival and well-being of the mother and her child and encompasses the health care dimensions of family planning and prenatal, natal, and postnatal care with the aim of reducing maternal and child mortality.47
In our study, failure to utilize available reproductive health care services such as ANC visits, TT injection during pregnancy and contraceptives resulted in a higher susceptibility to neonatal mortality. The main purpose of ANC is to ensure optimal health outcomes for the mother and her baby and its content service package as outlined in the WHO guidelines, which include screening for complications, health education for healthy lifestyle, 2 TT injections and 90 IFA tablets.48 The causes of neonatal deaths could be minimized or prevented through ANC interventions and WHO has recommended four or more ANC visits – the first two during the first two trimesters and the last two visits during the last trimester.48 Mothers who fail to attend the recommended visits are at a higher risk of poor birth outcomes. Furthermore, a study also identified that one of the most effective ANC intervention was TT injection given to women during pregnancy to prevent infant deaths due to neonatal tetanus, a leading cause of neonatal death in developing countries where a high proportion of deliveries take place at home or in places where hygienic conditions may be poor.49 To improve antenatal care service delivery, outreach programmes by skilled health personnel to administer ANC services such as check-ups and TT injection could effectively and significantly reduce neonatal mortality.50
Strengths and limitations
This study has some strength. First, the dataset used in this study were obtained from nationally representative household surveys and the variables are similarly defined in all surveys, hence comparable across all countries. Second, this study is population-based with a high response rate (>90%) and data were pooled together to create a large sample size of neonatal deaths reported within 5 years preceding the surveys. Third, this study applied appropriate statistical adjustments to data obtained from 5 nationally representative surveys and was able to identify the significant factors associated with neonatal mortality across the region to inform policy prioritization.
Despite these merits, this study also has some limitations. First, due to the cross-sectional nature of the study design, this paper is unable to establish a causal relationship between neonatal mortality and the independent variables. Second, the newborns’ dates of birth and death were from retrospective data based on self-report from mothers and this could be a potential source of recall and misclassification bias. Third, the rationale used by the mothers in estimating the size of their babies is unclear; hence, caution should be taken in interpreting the relationship between the mother’s perceived birth size and neonatal mortality. Finally, the antecedent health and nutritional status of newborns and their mothers, especially for those newborns that had died, and causes of death were not reported in the DHS surveys.
This study is useful in identifying the most significant underlying factors associated with neonatal mortality across the African Great Lakes region to assist in formulating effective preventive and curative interventions that addresses these factors among the most vulnerable sub-populations. This is particularly important as the region is recovering from wars, and our findings should inform development initiatives addressing maternal and child health to reduce socioeconomic inequalities in neonatal mortality. Given the large proportion of under-five deaths occurring during the neonatal period, it is imperative that evidence-based cost-effective interventions aimed at improving child survival during the neonatal period are implemented alongside the development of a coherent neonatal health policy by each country across the African Great Lakes region.
CONCLUSIONS
This study shows that a complex set of factors increase the risk of neonatal mortality: sex of child (male), perceived birth size (smaller than average), birth order and interval (first child and 4th or more child with >2 years birth interval), previous death of baby, non-usage of contraceptives, non-receipt of TT injection, no antenatal care visits and delivery through caesarean section. Hence, interventions to prevent neonatal mortality should focus on developing a coherent neonatal health policy that increases access to affordable health care as well as improves the quality of health care services rendered to women and their newborn. Additionally, cost-effective interventions aimed at increasing maternal awareness on the importance of healthy birth spacing, proper nutrition and health services utilization are needed across the African Great Lakes region. This intervention strategies will align the region with the Sustainable Development Goals (SDGs) target of reducing neonatal mortality to as low as 12 deaths per 1,000 live births by 2030.
Acknowledgements
The authors are grateful to Measure DHS, ICF International, Rockville, Maryland, USA for granting access to the datasets used in this analysis.
Ethics approval
The first author communicated with MEASURE DHS/ICF International, Rockville, Maryland, USA and was granted permission to download and use the DHS datasets for Burundi, Congo DR, Kenya, Rwanda, Tanzania and Uganda. Hence, no ethics approval was needed.
Funding
No grant was received for this study from any funding agency in the public, commercial or not-for-profit sectors.
Competing interests
The authors have completed the Unified Competing Interest form at http://www.icmje.org/coi_disclosure.pdf (available on request from the corresponding author) and declare no conflict of interest.
Correspondence to:
Blessing Jaka Akombi
School of Public Health and Community Medicine
University of New South Wales
Sydney
New South Wales 2052
Australia
[email protected]