


Diarrheal disease persists as a leading cause of preventable death for children in the world’s poorest settings. In 2010, there were 1.731 billion episodes of diarrhea among children under five years of age (U5) globally, including 36 million severe episodes, averaging three episodes per child.1–3 The World Health Organization (WHO) reported in 2013 that diarrheal disease is the second top killer of children U5, claiming the lives of around 760,000 young children every year. Given that 88% of diarrhea cases are related to poor conditions of water, sanitation, and hygiene (WASH),4 it is essential that safe drinking water and good sanitation and hygiene habits be promoted and practiced to prevent a majority of these deaths. With this aim, World Vision launched its For Every Child Campaign (FECC) to increase the number of children with access to life-saving WASH interventions. World Vision implemented FECC across 10 African countries in 3 of its operational regions (West, East, and Southern) between 2010 and 2011, and broadened the program scope to another 12 African countries in 2012. This WASH program was implemented through 2016 to fulfill the vision that “Every child deserves clean water.”
Modeling assessment software: Spectrum
Spectrum is a suite of models that provides policymakers with an analytical tool for supporting the decision-making process.5–7 Among seven software models in Spectrum, the Demography Projection model and the Lives Saved Tool (LiST) (Johns Hopkins University, Baltimore, USA) were mainly used to estimate the impact of World Vision WASH programs in the target countries: Malawi, Mozambique, and Zambia. LiST is a model to estimate the impact of scaling up health and nutrition interventions on newborn, child, and maternal health.8 WASH and WASH-related health interventions were mapped, recording mismatches and proxies that were used when misalignment occurred. Baseline and mid-term data were then sourced for all interventions collected. For model specification, those data were entered in LiST to create plausible scenarios and parameters for the rate of change in intervention coverage levels over time. For the actual LiST modeling exercises conducted, we created projections for the various scenarios under study and then analyzed outcomes.
World Vision FECC WASH program
The aim of the World Vision FECC WASH program is to ensure that each of the 11.8 million beneficiaries in the FECC target areas will not only have basic access to clean drinking water, adequate sanitation, hand-washing, and menstrual hygiene facilities, but will also be trained in hygiene promotion and behavior change by 2020.
The purpose of this modeling assessment is to estimate the impact of FECC WASH interventions on U5 child mortality from 2010 to 2014 in three of World Vision’s Southern African countries: Malawi, Mozambique, and Zambia. In addition, the application of LiST modeling strengthens the quantitative evaluation system of the World Vision 7-11 strategic framework on maternal, newborn, and child health and nutrition (MNCHN). The WASH program was continuously implemented from 2010 through 2014 in 76 area development programs (ADPs), World Vision’s primary unit for implementing its interventions at the community level (20 in Malawi, 26 in Zambia, 30 in Mozambique). The total target population in the 76 ADPs was 2,831,535. National data, such as the Demographic Health Survey (DHS), Joint Monitoring Program (JMP), and Countdown to 2015 for each country were also used to approximate data not available in the subnational levels.
World Vision collected WASH data using several different collection forms, including water facility monitoring, household tools, hygiene promotors, and standard training forms for monitoring and evaluation (M&E). After the World Vision staff, hygiene promotors, or community champions collected the data, the results were summarized and reported to the national office. The number of beneficiaries was determined by counting the number for each water facility constructed as per government policy. The beneficiaries were people living within the facility area, and these were a section of the catchment population in the World Vision’s operation area. Although it could under- or overestimate the standard numbers per water facility, it would provide an approximation giving a general sense of the impact of WASH interventions. In most cases, the number of beneficiaries in our study could be conservative counts because most water points were planned and designed to serve a World Vision community only where ADPs had clear information about the number of inhabitants.
WASH programs and interventions in target countries
The Malawi WASH (MWASH) program goal was to improve the health and well-being of 381,012 community members, including 104,000 primary-level schoolchildren by 2015, through improved access to safe water, adequate sanitation, and hygiene education. MWASH was initially implemented in 13 ADPs and expanded to 7 additional ADPs, resulting in a total of 20 ADPs with a 594,484 target population (Table 1). During the four years of MWASH implementation (2010 to 2014), the program resulted in 334,103 clean water beneficiaries and 573,168 improved sanitation and hygiene beneficiaries.
The Mozambique WASH (MozWASH) program goal was to improve the health and quality of life of 832,500 people, including 364,500 children, through sustainable access to and use of adequate potable water, improved sanitation facilities, and good hygiene practices. MozWASH implementation began in the Zambezia province in 2011, reaching beneficiaries in 9 ADPs. Additionally, 6 ADPs in the Nampula province, 8 ADPs in the Gaza province, and 7 ADPs in the Tete province were included, resulting in full MozWASH implementation in 30 ADPs with a target population of 1,307,059 (Table 1).
During the 3 years of MozWASH implementation (2011 to 2014), the program resulted in 175,200 beneficiaries with access to clean and safe water and 313,605 beneficiaries with safe sanitation and hygiene.
The Zambia WASH (ZWASH) program goal was to contribute to the improved health, nutrition, education, and well-being of 300,000 people, including 100,000 children, through improved access to safe, sustainable supplies of potable water, adequate sanitation, and hygiene education. ZWASH was originally launched to provide safe water, adequate sanitation, and hygiene education for 165,000 people in Zambia’s Southern province. In 2010, ZWASH was expanded through FECC to 5 additional provinces (Copperbelt, Eastern, Lusaka, Northern, and Northwestern) in districts with low access to WASH and high incidence of diarrhea. Another 10 ADPs were added, resulting in full ZWASH implementation in 26 ADPs with a 929,992 target population (Table 1). During the 4 years of ZWASH implementation (2010 to 2014), the program resulted in 505,137 clean water beneficiaries and 20,438 households with access to improved sanitation. It also sensitized 2,802 communities to sanitation benefits and technologies and sensitized 2,059 communities to hygiene benefits and practices.
Cause of all postneonatal diseases due to diarrhea
LiST results indicate that diarrhea is the sixth-leading cause of death among children from birth to 0.9 months and first cause of death among children from 1 to 59.9 months (Table 2).
We visualized how the five WASH interventions available in LiST can prevent diarrhea, how diarrhea indirectly causes stunting, and how stunting serves as a risk factor for increased infectious disease incidence in children U5 (Figure 1). 5,6
_visualizer_for_diarrhea_incidence__redesigned_from_the_child_healt.png)
In addition to the presentation of distinct mortality risk during each episode of diarrhea (due to dehydration), frequent episodes of diarrhea deprive young children of the nutrition necessary for proper growth and the ability to resist infections, thereby greatly contributing to malnutrition and morbidity, as well as increased risk for other life-threatening infections, chiefly including malaria, pneumonia, and measles.5,7 Therefore, more than half (52%) of the total combined U5 deaths in Malawi, Mozambique, and Zambia (directly, due to diarrhea, and indirectly, due to malaria, pneumonia, meningitis, and measles) were WASH-related at the beginning of the program (Figure 2).
_cause-of-death_distribution_in_study_countries_at_the_national_level__2010.png)
One study found that “a higher cumulative burden of diarrhea increases the risk of stunting”; the adjusted odds of stunting increased by 1.13 for every 5 diarrhea episodes and by 1.16 for every 5% unit increase in longitudinal prevalence of diarrhea5. Stunting magnifies vulnerability and high relative risk for other postneonatal diseases, such as pneumonia, malaria, and measles.7 Thus, the effort of implementing WASH interventions to prevent diarrheal incidence would be a good start for preventing several complications caused by stunting.
METHODS
Data analyses
The preliminary LiST analysis was conducted at the primary sites for the study in each country: Choma in the Southern Province of Zambia (during October of 2014), Lilongwe in Malawi (during November to December of 2014), and Maputo in Mozambique (during January of 2015). Later, data were reanalyzed by reflecting the most accurate method of creating a subnational projection from LiST.
Comparison of World Vision WASH interventions to LiST WASH interventions
For quality assurance purposes, it was important to match World Vision interventions against LiST interventions to the highest degree possible. However, there were incomparable cases when data were unavailable, so we needed alternative ways to measure coverages. For WASH intervention coverages in which misalignment occurred, we designed a detailed explanation of how each of the corresponding World Vision WASH interventions was translated into an appropriate format through a few mathematical steps, aligning it with the definition of LiST WASH interventions by proxy (Table 3).9–11
Because LiST mainly uses the percentage changes of indicators to estimate the impact of interventions, it was impossible to include any potential confounding factors for estimating more accurate causal association. In addition, LiST cannot include more detailed information or variations such as water point failure rates or baseline of water pipes.
Scope of LiST
LiST is one component of the Spectrum software suite, which is a mathematical modeling package. By automatically calculating mathematical relationships between changing coverage on mortality impact, the software’s modules allow analysts to simulate the potential consequences of varying scenarios to estimate (past and future) lives saved when introducing or scaling up key interventions. It shows the resulting impact of increasing proven MNCHN interventions as follows:
-
Additional deaths prevented in the stillbirth, neonatal, children U5, and maternal brackets by cause and by intervention relative to the impact year (the number of deaths averted each year compared to the first year of the intervention program);
-
The reduction in the mortality rates (maternal mortality ratio [MMRatio], maternal mortality rate [MMRate], neonatal mortality rate [NMR], infant mortality rate [IMR], and U5 mortality rate [U5MR]);
-
Percent of children in different height-for-age statuses (stunting) and weight-for-height statuses (wasting);
-
Incidence and etiology (incidence rate, the number of cases, and cases averted).
In order to maximize the results of the study for practical WASH program in Malawi, Mozambique, and Zambia, we prioritized the following outcomes and intermediary effects in World Vision FECC target areas: number of lives saved, percentage increase in lives saved, decrease in U5MR, cases of diarrhea averted, and decrease in diarrhea incidence rates.
In LiST, there were five WASH interventions (Table 3). There were 13 LiST WASH-related health interventions that would have been a positive influence on the impact of World Vision WASH program (Table 4).
Scenarios for Lives Saved Tool analysis
LiST is an innovative approach for quantifying FECC’s impact. Specifically, the modeling exercise compared the following four scenarios:
-
Scenario 1 (SC1): LiST analysis through scaling up coverage of water interventions alone (improved water source and household water connection), while assuming coverage of sanitation and hygiene and WASH-related health interventions stay constant over time;
-
Scenario 2 (SC2): LiST analysis through scaling up coverage of sanitation and hygiene interventions alone (improved sanitation, handwashing with soap, hygienic disposal of children’s stools), while assuming coverage of water and WASH-related health interventions stay constant over time;
-
Scenario 3 (SC3): LiST analysis through scaling up coverage of WASH interventions (improved water source, household water connection, improved sanitation, handwashing with soap, hygienic disposal of children’s stools), while assuming coverage of WASH-related health interventions stay constant over time;
-
Scenario 4 (SC4): LiST analysis through scaling up coverage of all WASH interventions and WASH-related health interventions.
Subnational population projections
Six LiST files (one national file and five subnational files) were created for each country: “[country initial]_nat’l_baseline,” “[country initial]_sub_baseline,” “[country initial]_sub_proj_SC1,” “[country initial]_sub_proj_SC2,” “[country initial]_sub_proj_SC3,” and “[country initial]_sub_proj_SC4” (country initial: M for Malawi, Moz for Mozambique, Z for Zambia; nat’l: national; sub: subnational; proj: projection). Baseline is when intervention coverages do not change over time, while projection is when intervention coverages increase over time. It is also noted that baseline has another meaning when we talk about the year interventions began in each country. We obtained the “[country initial] nat’l_baseline” file from LiST without modifying population size and intervention coverages. There were several steps to create subnational projections from this national baseline file. First, we converted all numbers for PMTCT, adult antiretroviral therapy (ART), and child treatment in the AIDS Impact Model (AIM) of LiST into percentages. Second, the “international migration” tab under the DemProj module was adjusted to produce the number of total net migrants per year at a subnational level by multiplying the ratio for the subnational to the national total population (TotPopSN/TotPopN). Third, the “total fertility rate (TFR)” tab under the DemProj module for rural areas of the country were used as proxy,12–14 and the ratio for the subnational to the national TFR (TFRSN/TFRN) was multiplied by the national TFR. Fourth, the default national value of the HIV incidence under the AIM module and the contraceptive prevalence rate (CPR) under the Family Planning (FamPlan) module were used for the subnational region. Fifth, under the DemProj module, the ratio for TotPopSN/TotPopN was multiplied by the baseline national population to produce the total population at the specific subnational level. Sixth, the intervention coverage estimates in the baseline and endline were entered, and then linear interpolation between baseline and endline was used in the subnational projections. Seventh, NMR, IMR, and U5MR were adjusted by using the values of rural areas of the country as proxy.12–14 Information about national population, subnational population, and subnational/national ratio in each country is provided in Table 5.
RESULTS
All four scenarios were designed beforehand to conduct LiST analysis. Our original plan was to compare SC1 with SC2 to see which intervention – water, sanitation, or hygiene – would save the most lives. Also, we expected that comparing SC3 and SC4 would tell us whether incorporating WASH-related health interventions into traditional WASH interventions would dramatically increase the saving of lives. However, there was no substantial difference between the SC1 and SC2 interventions, so it would be better to display SC3 as a combined effect. Furthermore, most information about WASH-related health interventions was not available in all three countries, so only SC4 was not projected (Table 4). Thus, we concluded that SC3 was the most feasible and realistic retrospective analysis of World Vision WASH-focused activities. Since SC3 was basically the combination of SC1 and SC2, it could show the comprehensive impact of the World Vision WASH program. The outcomes presented here are results from the SC3 (combined effect of all five WASH interventions available in LiST) summary analysis for Malawi, Mozambique, and Zambia.
WASH coverage increases between 2010 and 2014
We calculated subnational population estimates for the target World Vision ADPs under study (Malawi: 594,484 population in 20 ADPs; Mozambique: 1,307,059 population in 30 ADPs; Zambia: 929,992 population in 26 ADPs) (Table 1). To match the definitions of World Vision WASH interventions with those of LiST WASH interventions that were not directly comparable, we calculated “improved water source,” “water connection in the home,” “improved sanitation,” “handwashing with soap,” and “hygienic disposal of children’s stools” intervention coverages by designing translation methods (Table 3). This process enabled us to input World Vision WASH intervention coverages into LiST coverage data. The results indicate that WASH program coverage levels have increased since 2010 in all of the ADPs under study (Table 6).
Number of U5 lives saved from diarrhea, pneumonia, meningitis, and measles
According to LiST, 917 to 929 children U5 (Table 7) were saved from death caused by diarrhea, pneumonia, meningitis, or measles (excluding the baseline coverage effect) due to safe water, sanitation, and hygiene interventions across World Vision FECC program areas in all three countries between 2010 and 2014.
2010 includes only the results from Malawi and Zambia. We considered these numbers (the number of U5 lives saved: 166 to 168 in Malawi, 271 to 273 in Mozambique, and 480 to 488 in Zambia) as a major conclusion.
Percentage increase in U5 lives saved from diarrhea, pneumonia, meningitis, and measles
One of the most compelling findings of this study was the percentage increase in child lives saved from diarrhea due to WASH interventions within FECC target populations. According to LiST, a minority of additional deaths prevented could be attributed to pneumonia, meningitis, and measles. Results of LiST analysis revealed a regional-level mean upsurge of 131% in U5 lives saved from diarrhea and other causes as compared to no coverage changes, across the region (63% increase in Malawi, 121% increase in Mozambique, and 223% in Zambia) (Table 7, Figure 3). There is math behind the LiST model to calculate the number of lives saved. According to LiST, effectiveness is “the percent of deaths due to a specific cause that are reduced by the intervention” and affected fraction is “the percent of deaths due to a specific cause which are potentially able to be impacted by a specific intervention.” The reduction in mortality by single intervention is equal to effectiveness of the intervention × increase in the coverage of intervention × affected fraction ÷ unrealized potential impact. The total mortality reduction by multiple intervention is equal to the product of each intervention’s impact on the remaining mortality.15 The number of lives saved in the “no coverage changes” bar was calculated assuming a lack of WASH intervention coverage changes throughout the implementation of the program, whereas the “projection” bar scaled up actual intervention coverages in 2014.
_lives_saved_from_diarrhea__2010_2011-2014.png)
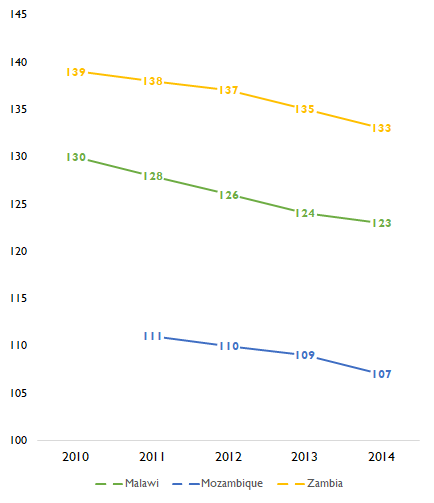
Decrease in U5MR
WASH interventions largely prevented more child mortality than maternal mortality. Therefore, among various types of mortality rates (MMRatio, MMRate, NMR, IMR, U5MR), U5MR (deaths per 1,000 live births), which includes NMR and IMR, was considered as the most appropriate indicator to reflect the impact of World Vision WASH program on lives saved. From LiST analysis, U5MRs in all three countries’ target program areas decreased throughout the time that the WASH interventions were underway. U5MR steadily decreased in each country from the initiation year to 2014 (5.38% decrease in Malawi, 3.60% decrease in Mozambique, 4.32% decrease in Zambia) (Figure 4).
_mortality_rate_(deaths_per_1_000_live_births)__2010_2011-2014.png)
It reflected a 4.47% mean decrease in U5MR in all three countries. This U5 mortality decreasing trend was based on LiST results of the difference attributable to the World Vision WASH interventions in the target population. The consistent subnational trend for all areas in which World Vision works is important to consider, given the high impact of WASH on child mortality. 16
Cases of diarrhea averted
The estimated target U5 population in the baseline in study countries was 541,935 (104,629 in Malawi; 245,727 in Mozambique; 191,578 in Zambia). We extracted U5 percentage distribution from the total population by age in the rural area (17.6% in Malawi, 18.8% in Mozambique, 10.6% in Zambia) from DHS data in each country as proxy, and Countdown 2015 data were reviewed for reference.13,14,17–20
The results of LiST analysis indicate that enormous numbers of U5 diarrhea and severe diarrhea cases have been prevented since 2010 in the ADPs where the FECC WASH programs were implemented: 809,552 moderate diarrhea cases averted (164,084 in Malawi; 289,713 in Mozambique; and 355,755 in Zambia) and 17,662 severe diarrhea cases averted (3,582 in Malawi; 6,320 in Mozambique; and 7,760 in Zambia) over time (Figure 5).
_population_and_u5_diarrhea__severe_diarrhea_cases_ave.png)
Overall, 1.53 cases of diarrhea (827,214 moderate to severe diarrhea cases averted divided by 541,935 target U5 population size) were prevented for every child U5 in these three countries between 2010 and 2014. The data revealed the total illness due to diarrhea that was prevented throughout the intervention period, while the number of lives saved would tell us only the extreme measures (mortality, that is to say, alive or not). In other words, an emphasis also needs to be placed on cases averted. Furthermore, as previously noted, those children who develop frequent episodes of diarrhea are more likely to be malnourished and suffer from other life-threatening infectious diseases. Therefore, preventing diarrhea has a significant intermediary effect on deaths due to multiple additional causes.
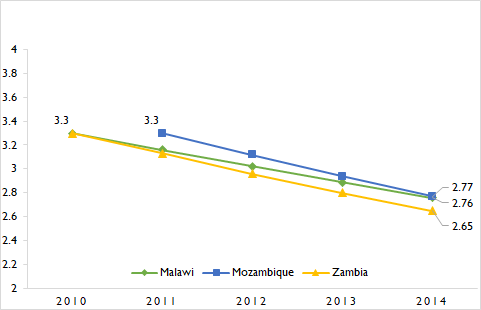
Decrease in diarrhea incidence rates
The decrease in the diarrhea incidence rate was measured for each country. The number of new diarrhea cases per child U5 each year has been decreasing steadily (0.54 cases per child per year decrease in Malawi, 0.53 cases per child per year decrease in Mozambique, and 0.65 cases per child per year decrease in Zambia) (Figure 6).
_diarrhea_incidence_rates_(case_per_child-year)__2010_2011-2014.png)
Assuming that the average of incidence rate for these three countries without WASH interventions is 3 cases per child per year1–3 over four years, the total number of diarrheal cases per child for four years would be 12 cases. According to the findings for cases of diarrhea averted, every child might avert 1.53 cases of diarrhea across the four-year span. Thus, the combined interpretation of the cases of diarrhea averted and the decrease in diarrhea incidence rates indicated that 12.75% (1.53 out of 12 cases) of all diarrheal cases were prevented due to WASH interventions.
DISCUSSION
Unavailable basic information for LiST subnational projection
Exact subnational data was difficult to obtain. A number of unavailable specific subnational data needed to be entered in LiST, such as mortality rates, HIV prevalence, and contraceptive prevalence rates, so the rural area values from DHS, JMP, Countdown to 2015, or default values from LiST had to be used as proxy.
No estimated cause of death profiles was found at the specific ADP level, so we had to rely on the cause of death structure at the national level of all countries combined to predict what kinds of diseases exist at the local level as proxy. We used LiST to analyze the relative proportion of diarrheal diseases responsible for U5MR within World Vision WASH program target areas, across all three countries combined (Malawi: 15,574,213 in 2010; Mozambique: 25,148,360 in 2011; Zambia: 14,422,951 in 2010) (Figure 1). This cause-of-death distribution generally gave us a better sense of the background and status of baseline in the study countries. LiST results indicate that diarrheal diseases, which are directly preventable by WASH interventions, constituted 12% of total U5MR among the national populations under study (Figure 1).
Insufficient WASH-related health intervention data
For this study, it was not feasible to calculate the variances in WASH-related health intervention coverage levels because of the lack of integration among the most relevant health and WASH data. We expected to run the modeling assessment with SC4, “LiST analysis through scaling up coverage of all WASH interventions and WASH-related health interventions,” but there was insufficient data to model SC4 (Table 4). Given the limitations of the study related to availability of WASH-related health data, this left only five WASH interventions in LiST (SC3)—improved water source, water connection in the home, improved sanitation, handwashing with soap, and hygienic disposal of children’s stools—available for the modeling assessment.
Underestimation of lives saved
Modeling WASH issues alone without integrated prevention and treatment of waterborn, diarrheal, and other infectious diseases did not prove be an effective method to avert a substantial number of deaths and illnesses in young children through LiST. The total number of lives saved, 917 to 929 in all three countries, was much smaller than we expected. There are jour major reasons for the small number of lives saved.
First, we suppose that as more LiST intervention coverages are used, the number of projected lives saved will increase. For this study, only 6% of the interventions in LiST were used for analysis (i.e., the 5 WASH-focused interventions as detailed in the SC3 description, among more than 80 interventions total in LiST), while all other intervention coverages remained constant; thus, the number of lives saved was insubstantial. If 13 WASH-related health intervention coverages had been available, the number of lives saved would have increased substantially. In addition to a total of five WASH intervention coverage variables, LiST could have considered other relevant coverages mentioned in Table 4 to calculate the number of total deaths. Second, the degree to which WASH coverage increased from 2010 to 2014 was not substantial (Table 6). The coverages that did not especially increase were “water connection in the home” and “hygienic disposal of children’s stools.” If all five WASH intervention coverages had increased greatly, the number of lives saved would have been much higher. Third, only 12.75% (1.53 out of 12 cases) of all diarrheal cases of each child over a four-year duration was prevented due to World Vision WASH interventions, which means that each child must have still suffered 10.47 cases of diarrheal diseases. Thus, 87.25% (10.47 out of 12 cases) of diarrheal diseases that were not prevented by World Vision WASH interventions must have caused child deaths from diarrhea. Fourth, for the conversion of WV interventions to LiST interventions output level data was converted into a percent, but it is technically still not a coverage level statistic because program data was used instead of coverage level data. Program data typically only captured the population in need (denominator of coverage) and the beneficiaries who received the intervention (numerator of coverage), which were not actual coverage in the World Vision program area. Our assumption around converted program data could have been another factor that contributed to underestimation of lives saved. However, it is unknown because we know that the sustainability of interventions, especially of sanitation and hygiene are a challenge for the sector, including World Vision.
Alignment with LiST interventions
According to the Child Health Epidemiology Research Group (CHERG) standards, LiST reflected the most current evidence on intervention effectiveness. World Vision’s definition of intervention differs from LiST’s definition, so the existing WASH data varied considerably in relation to intervention definition and quality level. Thus, a substantial amount of effort was spent matching World Vision interventions to LiST interventions (Table 3). In order to achieve the most accurate estimate of LiST analyses, a standardized core set of health and WASH interventions should be used to align with the evidence-based set of LiST interventions. Particularly for retrospective assessment, success in showing the program impact would be best achieved through systematic baseline, midterm, and endline surveys using common monitoring interventions (with the same definitions used in LiST, which can be turned into coverage information) across contexts.
Setting order of priority among LiST analyses
Given the study’s limitations of different time and scale variables, a simple comparison of lives saved in each country should be carefully considered for the following three reasons:
-
Target population sizes were different in each country (Malawi: 594,484; Mozambique: 1,307,059; Zambia: 929,992). If we model the three countries individually and the intervention coverage is similar in each country, a higher number of lives will be saved where the population is larger.
-
The baseline years were different. While MozWASH began its program in 2011, ZWASH and MWASH began their programs in 2010. In other words, MozWASH received the benefit of WASH interventions for one fewer year in comparison to ZWASH and MWASH.
-
Although countries were expected to use a common M&E framework, World Vision national offices in each county used their own M&E tools in practice. In addition, the varying cultural norms, technical capacities, and World Vision office structures were different in each country, so the methods of matching World Vision WASH interventions with LiST WASH interventions were slightly different.
Since all-inclusive health and WASH intervention data were not standardized to take full advantage of LiST for this study, we presented results from analysis on the following ordered effects and outcomes: 1) number of U5 lives saved, 2) percentage increase in U5 lives saved, 3) decrease in U5MR, 4) diarrhea cases averted, and 5) decrease in diarrhea incidence rate.
Changing WASH focus
CHERG used evidence-based scientific data for intervention effectiveness and affected fractions. All data were based on evidence, so those default values were used for analyses (Table 8).
The World Vision WASH program focused primarily on drilling boreholes, which was the least effective activity according to LiST. To increase the effectiveness of WASH to improve and save more children’s lives, WASH interventions should be broadened to include activities with the utmost proven efficacy. As per the tool, the default values in LiST show us that the WASH intervention with the highest degree of effectiveness is household water connection, followed by handwashing with soap (Table 7). Together, these two interventions would be more effective than the combined total of the other three (i.e., improved sanitation, use of latrines or toilets; hygienic disposal of children’s stools; and improved water source).
Although LiST provides generalized cost effectiveness analysis, it does not provide the cost per lives saved through each WASH intervention. The highest priorities using the expression of LiST interventions should be 1) to ensure that households have water connections on their premises or near their dwellings (this can include land plot/yard and be equivalent to a tap stand and/or water point from an alternative water system) and 2) to promote the regular availability of soap (or ash/another soap equivalent) for all households by empowering communities to prioritize this resource. Intensified emphasis on behavior-change communication is also critical, as the ultimate impact of WASH interventions depends on sustained uptake of positive behaviors by community members.
WASH-related health interventions
There are many WASH-related health interventions within the World Vision 7-11 framework for MNCHN that can prevent and treat waterborne and diarrheal diseases: full immunization for age, ORT, zinc and vitamin A supplementation, use of ITN, and appropriate breastfeeding and complementary feeding.21 If increased child survival, health, and well-being for U5 is to be realized, there must be more deliberate efforts to synergize and incorporate vital health interventions into WASH. For the next study, it is recommended that all WASH-related health interventions also be included for the modeling assessment of the WASH program.
Sampling and representativeness of the data
A total of 76 ADPs where those most in need of WASH were selected as sampling frames from the population of interest in Malawi, Mozambique, and Zambia. Since they were from non-probability sampling, selection bias might be unavoidable. Judgmental (or purposive) sampling was specifically used, but there were no unified inclusion and exclusion criteria for the sampling of ADPs across countries. In addition, each ADP is unique—it has its own staff and design, and geographic area of ADP varies in size, context, and population.22 Judgmental sampling may also misrepresent the overall population at large in those three Southern Africa countries. Notwithstanding the limitation of representativeness in general, it would be beneficial and replicable for similar settings, such as ADPs in other African countries where the current statuses of WASH are below the average that requires immediate implementation of the program for saving children’s lives.
CONCLUSIONS
The findings of this study through LiST quantitatively affirm the life-saving effects of the World Vision FECC WASH programs in Malawi, Mozambique, and Zambia. To reach the goal of preventing all three cases of diarrhea per child each year by 2020, program activities must include promotion and facilitation of household-level water connection and regular availability of soap or its equivalent, WASH-related health interventions must be fully incorporated into programs, and stakeholders must come together to raise awareness about integrated WASH programs.
Acknowledgements
We would like to thank World Vision staff from Malawi, Mozambique, and Zambia, who enabled us to have access to all relevant data and to conduct field research.
Funding
World Vision International and World Vision U.S. provided financial support for the WASH program in the Southern Africa countries.
Competing interests
The authors completed the Unified Competing Interest form at http://www.icmje.org/coi_disclosure.pdf (available upon request from the corresponding author), and declare no conflicts of interest.
Correspondence to:
Chulwoo Park, MSPH
Department of Global Health, Milken Institute School of Public Health
The George Washington University
950 New Hampshire Ave NW
Washington D.C., 20052
USA
[email protected]