The World Health Organization (WHO) reported diabetes to be among the ten leading causes of death in the last decade 2002-2012.1 Diabetes is estimated to affect approximately 422 million people globally.2 This has been estimated to increase to over 642 million in 2040.3–5 Overall, there has been an increasing trend in diabetes cases globally.
Diabetes has constantly been a public health burden in western countries such as the United Kingdom (UK), United States of America (USA) and Canada.6 Specifically, in the UK, diabetes prevalence is put at 6.2% equivalent to more than 4 million people affected by the condition.7 In the USA, diabetes affects more than 30 million people (prevalence 9.4%).8 Canada has 9.2% prevalence, translating to 3.5 million people.9,10 This global public health issue requires further research into prevention and management of subsets of the population.
However, diabetes burden is higher among immigrant groups that make up ethnic minority groups in western countries.11,12 According to the National Institute for Health and Care Excellence (NICE) ethnicity is a risk factor for the development of type 2 diabetes.13 Ethnicity is defined as the collection of individuals that can be grouped together as a result of shared national or cultural values, which can include religion, language, ancestry and society.14 Ethnic minority groups are individuals that belong to groups and have different cultural traditions from the main population.15 black African group is a minority group that are particularly affected by diabetes. They have been reported to have higher prevalence of diabetes in the literature.16,17 For instance, black Africans in Netherlands were reported to be more than five times more at risk of developing diabetes than the general population.18 Similarly, studies have reported health disparities among ethnic minorities as compared to the general population in the USA with reported health inequalities among these groups.19 Diabetes prevalence among African immigrants has been reported to increase with years of migration.20 This presents the need to understand disparity in health by comparing diabetes outcome measures among black Africans to white and South Asian populations.
The aim of this review is to explore the differences in diabetes management outcomes among ethnic groups with focus on black African population’s management. The interest in black African immigrants is because of the growth in this population and also due to the disparity in diabetes prevalence among this group compared to the general population in the host country. For example, they are among the highest growing ethnic minority groups in the UK.21,22 Although reviews have been conducted on diabetes management among South Asian and Caribbean groups 23–25, not much have been done in respect to black African population. To our knowledge, this is the first review comparing diabetes management outcomes among black Africans, white and South Asian populations.
METHODS
Study design and data sources
This review was carried out based on Search, AppraisaL, Synthesis and Analysis (SALSA) systematic review framework.26–28 Major databases were searched including: PubMed, CIHNAL, Medline, Web of Science, Scopus, and Science Direct were searched because they offer a good selection of publications that are related to this review question. The main search terms for this work were ‘Diabetes’, ‘Africa’, ‘ethnic minority’, ‘management’ and their alternative synonyms were entered into the databases searched (Table 1). These search terms were combined using Boolean operators to allow full retrieval of all articles that are related to the focus of this review. The protocol for this review has been registered on PROSPERO (CRD 42018088311).
Selection criteria
To meet the inclusion criteria, articles that are reported to be primary research, use either qualitative or quantitative methodology and peer-reviewed were selected for this review. The results of the search were screened from the title, abstract and finally full text. The First author (FA) screened all article’s title and abstract to assess their eligibility as meeting the inclusion criteria for the review. Details of inclusion and exclusion criteria are presented in Table 2.
Assessing quality of the papers
Each paper was appraised to assess the quality using relevant Critical Appraisal Skills Programme CASP 29 checklist for cross-sectional quantitative studies and another for qualitative studies was used for the appraisal. This checklist was selected as it provides a structural approach to assessing rigour of the articles.30,31 A score was assigned to each article based on how the study answered screening questions giving No = 0 and Yes = 1.32 Each study score was converted to the percentage of the total numbers of questions. It was decided to exclude any study that score below 50%, this was to avoid reviewing papers with less quality. No study had 100% of the screening score and no study was below 50% and so no study was excluded based on quality assessment as they were of satisfactory quality. Data were extracted from these studies to be included in the review.
Data extraction
Following the quality assessment of each paper, data were extracted using a data extraction tool. There are various types of data extraction tools that can be used in a review including paper, spreadsheets, email and web-based survey. The type used depends on the availability of funding, time for review and number of reviewers on the project.33 Data was extracted using Microsoft Excel (Microsoft Inc., Seattle WA, USA) spreadsheet by FA. Data were extracted on the aim of the study, the type of research methodology used, demographic information of the participants, key findings and conclusions from the study (Table 4).
Diabetes outcome measure targets
In the quantitative articles that were included in the review, diabetes prevalence and four outcomes measures were reported in most studies reviewed (haemoglobin a1c level, blood pressure, cholesterol level and body mass index). These outcomes were selected as they were reported by most of the articles reviewed. In addition, these outcomes are used as the most accurate measure of diabetes management and as an indicator of biomedical outcomes of care.49,50 Other measures like smoking, awareness, knowledge, self-management and complications were reported in some studies but are not reported in this review. Different outcome measures were used in the studies reviewed; this was mainly based on the geographical location of the study. For example, studies conducted in North American mainly use American Diabetes Association (ADA) and International Diabetes Federation (IDF) target recommendations. Studies conducted in the UK use NICE target recommendations while studies in Europe use WHO target recommendations. It was not possible to conduct a meta-analysis on the articles due to the heterogeneity of the data from the studies reviewed, particularly from target outcome measures used (Table 3).
Data analysis
Understandings of ethnicity within this literature review were based on the original authors’ concepts.
The term “Whites” was used to refer to people from the European or Caucasian origin. South Asia included people originating from Indian, Pakistan, Bangladesh, Maldives and Sri Lanka, while Black population was used to refer to people originating from Africa and the Caribbean. Studies review reported establishing ethnicity based on self-reported origin, country of birth or as indicated in the hospital records in the studies reviewed.
Articles reported recruiting black populations with no further clarification on the specific black group. Further information on specific group of black population recruited for study is needed due to several groups that make up the black population. This presented difficulty as it was not made clear if recruited African immigrants that migrated from Africa or African Caribbean that migrated from Caribbean countries. This is due to the cultural and social differences between the two groups, such as language, diet, religion, geography, acculturation and socioeconomic factors, combining these groups as one ethnic group does not allow imprecision and probably unreliable. Only two studies reported findings between Black African and African Caribbean in separate categories.34,46 This highlights the need to understand the heterogeneity Black population.
RESULTS
Search results
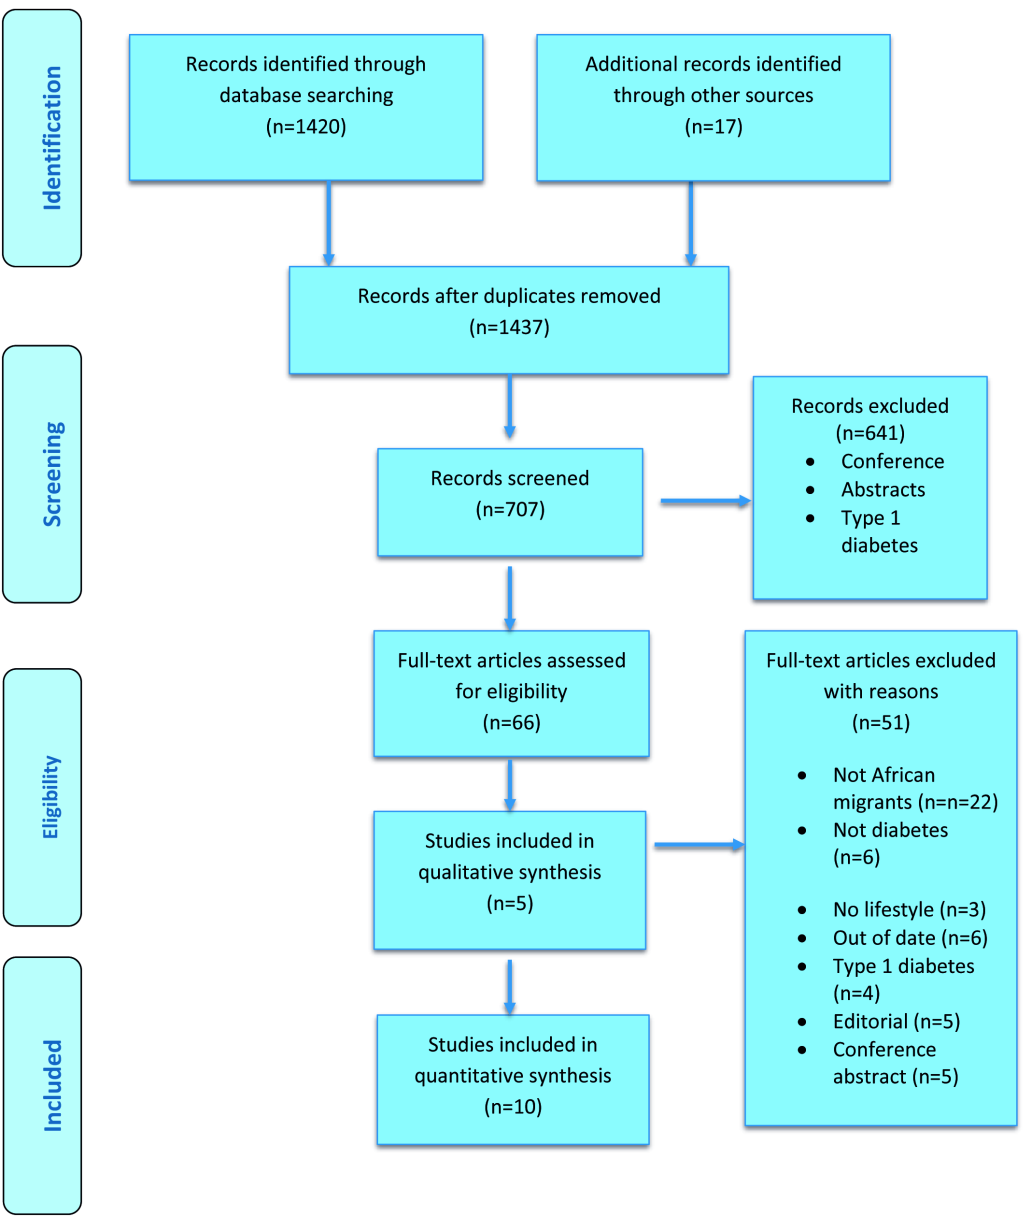
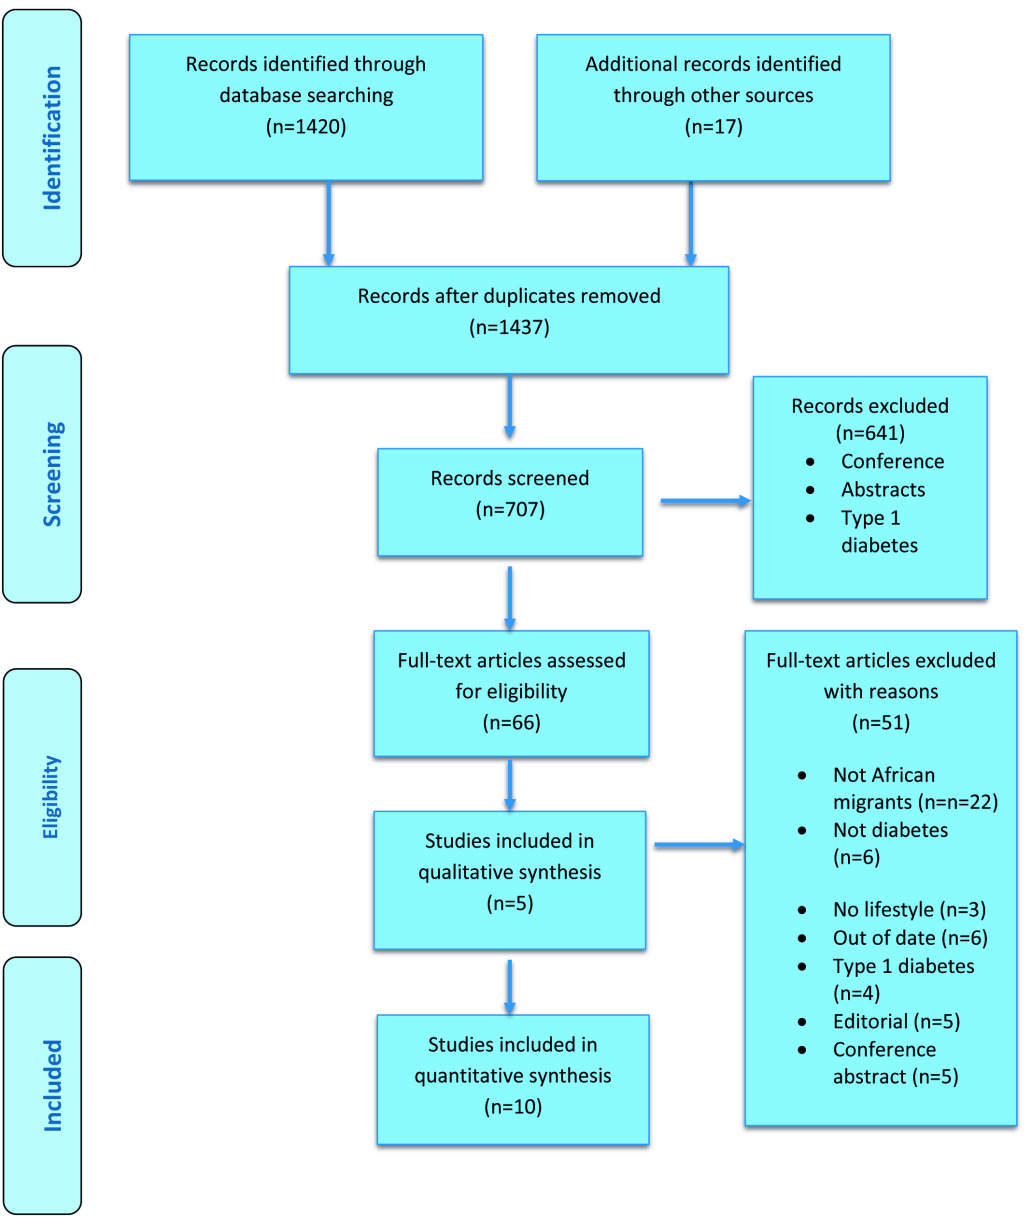
Articles published after 2006 were retrieved, this is to allow retrieval of more recent and current studies to be included in the review. Hard copies of all 66 full-text articles were printed out for a full screening; this led to the selection of 15 articles in the review with five qualitative and ten quantitative articles. A PRISMA flow diagram (Figure 1) was used to present details of the literature search and article retrieval.59 Full articles were printed to allow unbiased selection of articles to be included in the review and note taking on each article during appraisal.
Study characteristics
The ten quantitative studies included in this review were all cross-sectional studies. Sample size ranged from 359 to 34,345 with 127,273 total participants from all ten studies. All studies recruited participants aged 18 years and above. All the studies involved both male and female participants. Twelve studies were conducted in Europe with nine quantitative studies 34–36,40–42,45,47,60 and three qualitative studies.39,44,48 Three studies were conducted in American with quantitative study 43 and two qualitative 37,38 studies. Characteristics and key findings of each study are presented in Table 4.
Heterogeneity of black population
The heterogeneity of black population globally has necessitated the need for definition of specific groups of people in the black population. This is because of the sensitivity of findings from healthcare research requires focus on the specific group of blacks recruited in studies which may not be valuable if different groups of blacks are grouped as one. Therefore, there is a need to define subset groups within the black population. black population are defined as the groups of individuals with dark-skin and used for racial classification.61 black African which is a specific group in black population is used to describe individuals that originate from Sub-Saharan African countries. African Caribbean is used to refer to individuals that originated from Caribbean countries such as Jamaica, Trinidad and Tobago. Finally, African American refers to individuals that are citizen of America. Although the ancestral linage of African Caribbean and African American originates from Sub-Saharan African countries, the influence of slave trade has caused their movement to continents outside Africa.
Using phenotypic, racial classification for these groups will result in classification as one group. However, classifying using ethnicity will result in at least the three major groups described above. This is mainly because classifying using ethnicity goes beyond phenotypic characteristics to include characteristics such as language, diet, religion, geography.61 The importance of specific classifications in this review is due to the aim of the review. It is therefore essential to differentiate the black African immigrant population as the population of interest from other subset groups of black population.62The interest in black Africans is because this group is the smaller than African Caribbean and African-American and is underrepresented in healthcare research.
In the search of studies for this review, it was noted that majority of the articles retrieved recruited African Americans in the USA and African Caribbean in the UK. To meet the aim of this review, studies that only recruit African American or African Caribbean were excluded. Studies have to recruit black African immigrants to be included in this review for analysis.
Diabetes prevalence
Diabetes prevalence was one of the results reported among studies reviewed. This was reported by four studies included in this review.34,35,40,42 Diabetes prevalence was reported to be higher among black Africans and South Asians than the white population in all four studies. The lowest prevalence was reported among white population, followed by black African population and highest prevalence was reported among South Asian population in all studies. Diabetes prevalence was 1.3- 4 times higher in black Africans than white group. The highest prevalence was recorded among South Asians; diabetes was reported to be at least 2.2-7.3 times higher than white population. See Table 5 for diabetes prevalence reported in studies reviewed.
Haemoglobin A1c (HbA1c)
Three papers 35,45,46 reported mean HbA1c differences among all three ethnic groups. All studies reported higher mean HbA1c among black Africans and South Asians than the white population. Although differences were not statistically significant, black Africans had highest mean HbA1c values.
In addition to the mean HbA1c, control HbA1c was reported among eight studies reviewed.36,40–43,45,47 The control target differ among the studies with some studies using target of HbA1c < 7.0% 40,41,43,45,47, while James et al.36 used HbA1c < 7.5% target and Fosse-Edorh et al.42 used HbA1c < 8% target, Ballotari et al.34 reported percentage of participants with HbA1c > 9%. Most studies reported higher percentage of white population meeting HbA1c target than black African and South Asian populations.34,40-36,43 In comparison among black African immigrants in different European cities, Biljholt et al.34 reported a higher percentage of HbA1c target met among Ghanaian immigrants in Amsterdam, Berlin while lower percentage was reported in London. Interestingly, the percentage of HbA1c control target was similar in rural Ghana as compared to immigrants in Amsterdam and Berlin while the lowest percentage to meet target was reported in urban Ghana.Table 6 presents detailed HbA1c outcome measures reported.
Blood pressure
Blood pressure measure was reported by five of the studies reviewed.35,41–43,45 Blood pressure measure was reported to be higher among black Africans than white and South Asian groups. Similarly, the percentage that met blood pressure target was lowest among black Africans than white and South Asia populations. Although blood pressure target was not significantly different among all ethnic groups in four studies, one study reported a significant difference. Choukem et al.45 reported a similar percentage of participants with hypertension among Cameroonian and Caucasians respectively, while significantly lower percentage was reported among Cameroonian immigrants (See Table 7 for detailed blood pressure outcome measures reported).
Cholesterol
Total cholesterol measure was reported by six studies reviewed.35,36,41–43,45 Although different cholesterol targets were used in these studies, black Africans were slightly lower in cholesterol target percentage than white and South Asian populations. However, one study reported mean total cholesterol to be lower among Cameroonian immigrants than white groups.45 South Asians had the lowest cholesterol level among all ethnic groups. In general, cholesterol measure was not significantly different among all groups.Table 8 presents cholesterol outcome measures as reported in studies reviewed.
Body Mass Index (BMI)
BMI was reported by four studies in this review.36,40,45,47 Three out of the four studies reported lower mean BMI among black Africans than white population.36,45,47 Bijlholt et al.47 reported lowest BMI among participants in rural Ghana and urban Ghana as compared to immigrants in European sites. Among immigrants in European sites, BMI was similar in Amsterdam and Berlin while highest BMI was reported in London. Choukem et al.45 reported similar BMI value among Cameroonian and Cameroon immigrants with the highest BMI reported among Caucasian.
Similarly, James et al.36 reported lower BMI among immigrants than the white population. Lowest mean BMI was reported among South Asia, followed by black population while highest BMI was reported among white group. However, Snidjer et al.40 was the only study that reported lowest mean BMI among white participants while Ghanaian immigrants were reported to have mean BMI higher than white group.Table 9 presents detailed measure outcomes among quantitative articles reviewed.
Qualitative findings
Five qualitative articles were included in this review.37–39,44 These articles focus on explaining some factors that may contribute to the management of diabetes among immigrant population. Some of these factors help to explain the findings of diabetes management from the quantitative articles reviewed.
Delayed diagnosis
Studies reviewed reported how diabetes diagnosis is delayed among participants. Many individuals were reported to know about their diabetes status after visiting hospital for when other health issues. Kahn et al.37 reported that participants finding out about having diabetes when in emergency units for other health conditions. Many of the participants were diagnosed with diabetes only after noticing symptoms that made them require me require medication. This was reported to contribute to the management among these individuals, mainly as the late diagnosis can contribute to diabetes complications.
Emotions at being diagnosed
Emotions at being diagnosed with diabetes were reported to influence the management of diabetes.37,38 Participants were reported to be surprised at being diagnosed as it was not expected. Emotions such as denial, anger, acceptance and depression are some of the feelings participants were reported to go through after diagnosis. These emotions have different ways of contributing to the management of diabetes. Denial, anger and depression can be a barrier to proper management of their diabetes as recommended by health-care professionals.
Knowledge of cause of diabetes
Many of the participants were reported to have limited knowledge about diabetes as a disease condition.37,38 Kandarara et al.38 reported how participants explain not to have adequate knowledge about diabetes before diagnosed with the condition. As a result of limited knowledge prior to diagnosis, their management process has been affected. They reported having to learn everything about the condition after diagnosis which makes following management recommendation difficult.
Barriers to management
Some factors were reported as barriers to optimal management of diabetes in studies reviewed. Dietary struggle was a factor that was reported by participants as a barrier to their management of diabetes. Another barrier was unfamiliar diets recommended by healthcare professionals in managing diabetes.38,39 Difficulty in healthy cooking and cultural influence in dietary habits were also reported as barriers to management.37–39 Long hours of working due to the high cost of living were reported to hinder the management of their condition.37 Bramberg et al.48 used observational method for data collection reported the lack of individualised care by healthcare professionals as barrier to diabetes management. The observational study of diabetes appointment between diabetes nurse and patients reported how patients’ concerns on diabetes management were not properly addressed due to the lack of individualised care for these patients.
Facilitators to management
Studies also reported some factors that enhance better management of their diabetes.38,44 This was reported by participants to help in managing their diabetes. Social support and having consistent routines or everyday practices to follow in managing diabetes was reported to enhance their diabetes management.38,44 Having culturally tailored recommended dietary plans was reported to facilitate diabetes management among participants.39 There are important implications of the findings from this review that requires further discussions.
DISCUSSION
This review was conducted to explore management outcomes differences among black Africans, South Asians and white population. This review found poorer diabetes management outcomes among black Africans as compared to South Asia and white population. Diabetes prevalence was higher among black Africans than the white population in all studies reviewed. In addition, diabetes management outcomes like HbA1c, blood pressure and cholesterol level were slightly higher among black Africans than other groups. Blood glucose level using HbA1c outcome was slightly higher among black Africans while white population had the lowest measure.
Black African participants in all studies were less likely to meet blood pressure target than white and South Asian populations except for one study where immigrants had lower blood pressure than Caucasians.45 It is worthy to note that these studies use different targets for all outcomes measured which might influence their findings. Studies conducted in the UK used stricter target measures of 130/80mmHg than the 140/90mmHg used in studies conducted in the USA. It is important to note that recently, blood pressure classification for hypertension have been moved from 140/90mmHg to 130/80mmHg which will make more than 46% of American hypertensive.63 New studies after this review may use the stricter target than studies in this review which may affect their findings.
In general, black Africans were reported to be least likely to meet all three outcome targets, although lower BMI was reported in three of the four studies that reported BMI measure. This review shows diabetes management disparity among ethnic minority groups when compared to white population; this disparity is particularly pronounced among black Africans. Similar findings have been reported in reviews.64,65 Agyemang et al.66 showed that blood pressure increase among African Caribbean population with increasing age exceeding other ethnic groups like white population.
Lower likelihood of meeting all HbA1c, blood pressure and cholesterol levels have been reported to increase the risk of developing diabetes complications.67
Another interesting finding is the differences in immigrant management on different European sites as reported in the review. London was a site that reported significantly lower management outcomes among other European sites although higher education percentage was reported among African immigrants from this site. This shows that there is poorer management outcome among immigrants, vary with country residence. It is therefore important to look into environmental influence on diabetes management.
Looking into diabetes management, some explanations for poorer management among black Africans were reported among the qualitative studies reviewed. These include the late diagnosis of diabetes, dietary struggles, and lack of individualised care. These factors are important in contributing to the adequate management of diabetes as they relate to lifestyle factors in the management of diabetes.68 Lifestyle factors have been shown to greatly influence the successful management of diabetes.69 This is particularly as diabetes management is importantly a self-management condition.57 Another explanation for the poorer management among black Africans might be due to lower awareness about diabetes. Lower awareness has been reported among this group concerning diabetes.70 Many of whom do not know their diabetes status and limited knowledge about diabetes as a condition was reported in the qualitative studies reviewed.
From the studies conducted in the UK in this review, only two studies reported separate diabetes management among black African and African Caribbean.34,46 This highlights the need to study these groups separately rather than combining all African groups as one homogeneous group. It has already been recommended to explore cardiovascular disease risk factors and health behaviours by country of emigration.71 This is of particular importance as it was not possible to know the percentage of black Africans and African Caribbean, which makes up “blacks” as reported in some studies. This makes interpreting the findings from these studies to each group difficult. In terms of the black populations, it is known that African Caribbean has a higher population and higher integration into the UK society due to the long years of stay than black Africans making them less represented in health research.22 However, black Africans are among the fastest growing ethnic groups in the UK 72,73 This should be reflected in studies that are conducted among “blacks”.
The variation in study methodology, measurement method, outcome target measures and the combination of black African and African Caribbean populations in some study should be put into consideration when interpreting the findings of this review. Standardizing the target measures for diabetes management outcome will be valuable to future research. In addition, there is a need for meta-analysis among African Caribbean and black African due to the difference among these groups. Better exploration of diabetes outcome among African immigrants in various locations in Europe is needed to understanding diabetes management as differences noted in this review. More research needed among black Africans residence outside London as this was the study location used in most studies conducted in the UK.
Limitations
Since the early 2000s, several reviews have been conducted to explore health differences among ethnic minority groups in western countries.23–25 However, no review has focused on comparison of health outcomes among ethnic groups living with diabetes with particular focus on black Africans. This therefore presents the findings of the review to be unique and relevant in terms of diabetes management among ethnic groups. However, several limitations were noted in conducting this review.
Limitations of this review include the small number of studies that were reviewed as relevant to the study aim. This reflected the limited literature available for comparison of diabetes management outcomes among black African, South Asian and white populations. Studies varied in terms of the research goal with only four studies having the primary goal of diabetes management outcome as primary aim of the studies.34,36,41,45 This in effect can influence the findings of this review as this highlights the lack of comparison studies among these three population groups.
In this review several decisions were made that might have affected the retrieval of studies that were included in the review. One of such decisions is the year of publication criteria that was used to retrieve only articles published after 2006. This was done to ensure that articles that have current information are included in the review. In addition, only peer review articles were included to reduce retrieval of low quality articles. Finally, only articles published in English were included in the review; this might have the effect of excluding relevant articles written in other languages. However, this was managed by ensuring that all articles were searched and relevant articles retrieved before exclusion based on language limiters. Abstracts of articles that have potential to be included in the review were translated before decision to include or exclude. However, none of the articles written in other languages was found to be relevant for inclusion in this review.
CONCLUSION
Diabetes prevalence is higher among black Africans than the white population. In addition, poorer management outcomes was observed among this population compared to both white and South Asian populations as noted in the reported biomedical outcomes (HbA1c, blood pressure, cholesterol). This disparity in diabetes management needs to be addressed to narrow the inequality gap among ethnic groups. Due to different targets used in the studies review, it was not possible to perform a meta-analysis. Standardised target measure is needed in future research to better use findings from studies. In terms of black group, there is need to for future research to recognise the different subsets of black population to allow findings tailored to a particular group in this population.
Acknowledgements
Many thanks to Bournemouth University’s Department of Public Health and Prof Edwin Van Teijlingen for their support.
Funding
This is part of a PhD project funded through Bournemouth University VC Scholarship.
Competing interests
The authors have completed the Unified Competing Interest form at http://www.icmje.org/coi_disclosure.pdf (available on request from the corresponding author) and declare no conflict of interest.
Correspondence to:
Folashade Alloh
Department of Human Sciences & Public Health
Faculty of Health and Social Sciences
Bournemouth University
Bournemouth House
Christchurch Road
BH1 1RX, UK
[email protected]