
Haiti has one of the world’s highest maternal mortality ratios – 332 women die per 100,000 live births1 – and a neonatal mortality rate of 25 per 1,000 live births.2 Most of these deaths can be prevented through comprehensive and skilled obstetric care during pregnancy, childbirth, and the post-partum period.3 However, there is a steep drop off between use of antenatal services and use of labor and delivery services in Haiti. While 90% of Haitian mothers use antenatal services, only 36% of births take place in health facilities and fewer than 3% of the births taking place outside of health facilities are attended by skilled personnel. 4 Increasing rates of facility-based delivery will be critical for Haiti to reduce maternal and neonatal mortality.5,6
Use of health services reflects the interplay of demand- and supply-side factors.7,8 Demand-side factors like socioeconomic status, education, available transport, birth order, prior use of antenatal services, and cultural norms are known to significantly impact women’s propensity to deliver in health facilities.9–12 Supply-side factors like location of health facilities, availability of trained health workers, infrastructure and supplies, cost of services, and other aspects of health facility readiness to provide quality delivery-related care are also important.10,11 However, analyses of how these factors come together to shape facility use have been limited by data availability and constrained by methodological challenges.13 Demand-side and service use data typically come from household- and community-level surveys, while supply-side data typically come from assessments of health facilities. To comprehensively explore factors that influence women’s propensity to delivery in facilities, these two types of data must be linked.
Previous studies have attempted to do so using the Demographic and Health Surveys (DHS), which provide nationally representative data on childbirth and other health outcomes in low- and middle-income countries (LMICs), and Service Provision Assessments (SPA), which assess the availability and quality of services at health facilities in the same countries. Most have simply linked households to their nearest facilities by Euclidean distance.14–16 However, the locations of DHS sampling clusters are randomly displaced prior to data release by up to 10 kilometers, meaning analyses like these are subject to misclassification error.17 Moreover, women often bypass the nearest facility if they believe the quality is inadequate.18
One way to address these problems is to characterize the central tendency of health facility readiness in an area surrounding each displaced DHS sampling cluster. A simple technique is to draw a circle of arbitrary radius around each cluster and include the mean readiness score across facilities within that circle as a covariate alongside the individual-level data from that cluster.19,20 However, this approach is still subject to serious risk of misclassification, as not all clusters have facilities nearby and are therefore dropped from analysis.17 Another approach has been to use Kernel Density Estimation (KDE) techniques to estimate a surface of health facility readiness across an entire country, ensuring that all sampling clusters are given estimates of distance-weighted facility readiness.21 However, previous attempts have chosen arbitrary bandwidths as parameters in their KDE, requiring strong assumptions about the rate at which health facility readiness decays over space.
Our objective was to explore facility readiness as a predictor of facility-based delivery in Haiti, controlling for other supply- and demand-side factors. Our challenge was to characterize readiness of delivery-related services, link that readiness to nearby births, and avoid the misclassification errors and strong assumptions made by previous studies. Our hypothesis was that delivering in a health facility is associated with the readiness of nearby facilities to provide quality delivery-related services, after adjusting for the density of nearby facilities, environmental characteristics like urbanicity, lighting at night, and terrain steepness, and the mother’s socioeconomic status, age, birth order, and marital status.
METHODS
Data sources
For our outcome and demand-side variables, we used individual-level birth data from the 2012 Haiti DHS,4 a population-based household survey providing representative estimates of health and social status for both urban and rural areas, and for the 10 administrative departments in Haiti. DHS staff interviewed 14,287 women. We included births occurring in the two years preceding the survey. Global Positioning System (GPS) coordinates of each sampling cluster centroid were included, though these were randomly displaced up to 5 kilometers, with 1% displaced up to 10 kilometers. In addition, we used DHS sampling cluster-level spatial covariate data provided by the DHS Spatial Data Repository.22
For our supply-side variables, we used facility-level data from the 2013 Haiti SPA,23 a census of all 907 public and private health facilities in Haiti. The SPA included an inventory of facility resources, an assessment of provider training, observations of patient encounters, and provider and patient exit interviews. True GPS coordinates of each facility were included.
Key variables
Our outcome of interest was binary, indicating whether each birth occurred in a health facility. Our predictor of interest was an estimate of distance-weighted, facility density-adjusted, delivery-related service readiness at the centroid of each DHS sampling cluster. We first estimated a readiness score for each health facility providing delivery services, based on the World Health Organization Service Availability and Readiness Assessment (SARA) theoretical framework.24 We created a composite score by summing the 52 binary indicators of general service readiness and 18 binary indicators of delivery-specific service readiness, as defined by the SARA. Examples of these binary indicators include whether each facility had a functioning emergency transport vehicle and whether each had supplies of injectable oxytocin on the day of the SPA data collection visit. We used these facility composite scores to estimate cluster-level service readiness – the level of delivery-related service readiness available to and accessibly by women living in each sampling cluster – by modeling surfaces of service readiness across the entire country. Hypothesizing that distance from a facility reduces the ability of a pregnant woman to access delivery-related readiness, we allowed readiness scores to decay over distance from health facilities. Further hypothesizing that rural and urban facilities had different reach and catchment area size, we modeled distinct surfaces for urban and rural health facilities, allowing the catchment area sizes for each to be different. Unlike prior analyses that defined arbitrary catchment area size, our model estimated these sizes directly. We linked this process directly to our inferential analysis, and detail the entire approach below.
We adjusted for covariates at the individual and sampling cluster levels that we hypothesized may confound the association between our outcome and predictor of interest. Covariates at the individual level included: mother’s socioeconomic status, age, birth order, and marital status. We derived mother’s socioeconomic status from a principal components analysis of maternal education and household wealth, as these two variables were highly correlated. Household wealth was an index score provided by DHS for each household, itself calculated using a principal components analysis of items related to household goods and other variables. We included the number of antenatal visits during the pregnancy in our descriptive statistics, though we hypothesized that this variable falls into the causal pathway between facility readiness and facility-based delivery. As a result, we did not adjust for antenatal service use in our model. Spatial covariates at the sampling cluster level included: rural or urban, aridity, built population, night lights, slope, and travel times. Aridity was an indicator of climate derived from the WorldClim Global Climate Data.25 Built population was an indicator of urbanicity derived from the GHS built-up grid.26 Night lights was an indicator of cloud-free radiance at night derived from the VIIRS Nighttime Lights Annual Composite.27 Slope was an indicator of terrain steepness derived from the United States Geological Survey GTOPO30 digital elevation model.28 Travel time was an estimate of the travel time to the nearest city of 50,000 people or more.29
Analysis
We derived a likelihood function that estimated each sampling cluster’s distance-weighted, facility density-adjusted, delivery-related service readiness, and simultaneously estimated the coefficients of a logistic regression including all other individual-, household- and cluster-level covariates. The likelihood function estimated four KDE surfaces: two for urban facilities, and two for rural facilities. This allowed us to estimate distinct KDE bandwidths (i.e., catchment area sizes) for urban and rural facility types. For each facility type, the likelihood function estimated an unweighted KDE surface where each facility was represented once, and a second weighted KDE surface where each facility was repeated based on its composite readiness score (e.g., a facility with a readiness score of 10 was repeated 10 times). For each facility type, the likelihood function subtracted the unweighted surface from the weighted surface, creating two facility density-adjusted readiness surfaces: one for urban facilities, and one for rural facilities. This allowed us to estimate cluster-level readiness as a function of nearby health facility readiness, independent of the number of nearby facilities. The likelihood function combined the two surfaces by taking the maximum density-adjusted readiness surface score at every pixel, at a resolution of 500 meters, and assigned cluster-level readiness estimates to the centroid of each DHS sampling cluster.
We used KDE for two reasons. First, the KDE bandwidth describes the rate at which readiness tends toward zero as a function of distance from each facility. KDE therefore combines the concepts of readiness and distance into a single metric accounting for the location of each sampling cluster vis-à-vis facilities. Second, KDE does not attempt to directly link births to facilities. Rather, KDE assumes a propensity to use facilities closer to the household, and describes a service readiness surface across the entire country. The function thus gave all sampling clusters a score, avoiding loss of data due to misclassification error.
Simultaneous to the above, the likelihood function used logistic regression to estimate the log-odds of a delivery occurring in a health facility, as a function of cluster-level service readiness, adjusting for our potential confounders. Robust standard errors accounted for clustering, and the regression adjusted for survey sampling weights provided by DHS. We used simulation to predict probabilities of the outcome given various counterfactual scenarios.
We used R for statistical analysis.30 We used ggplot2, ggmap, and tile to visualize our results.31–33
RESULTS
Data from 389 facilities offering delivery services were available for analysis. We present the characteristics of these facilities in Table 1. Most were in rural locations (238, 61.2%). Urban facilities were more likely than rural facilities to be hospitals (P<0.001) and had higher service readiness scores across all domains (P< 0.001) except for general: basic equipment (P=0.096) and general: standard precautions for infection prevention (P=0.59).
Data from 1,991 births occurring in 2011 or 2012 were available for analysis. We present the characteristics of these births in Table 2. Most births did not occur in a health facility (1252, 62.9%). Compared to births occurring in a health facility, births outside were by younger mothers (P=0.007), mothers with less education (P<0.001), mothers living in households with less wealth (P< 0.001), and mothers with more previous children (P<0.001). Mothers delivering outside of health facilities had fewer antenatal visits during the pregnancy than mothers delivering in health facilities (P<0.001). Births outside a health facility were also more likely to be in rural communities with lower aridity (P<0.001), less built population (P< 0.001), fewer night lights (P< 0.001), steeper slopes (P<0.001), and longer travel times to population centers (P< 0.001). Finally, births outside health facilities were in clusters with lower estimates of delivery-related service readiness (P<0.001).
Figure 1 visualizes our approach to linking the DHS and SPA datasets, alongside the KDE estimates, at the national and sub-national levels. The upper-left quadrant displays the positions of all health facilities in Haiti as yellow points, and uses contours and shading to show spatial heterogeneity in facility readiness given the estimates above. The lower-left quadrant displays the positions of all DHS sampling clusters in Haiti as red circles, shaded according to the proportion of births in each cluster occurring at a health facility. The upper- and lower-right quadrants display the same information at the sub-national level, centered on the town of Hinche.

Table 3 presents the results of the likelihood estimation. The model estimated that rural facilities spread their service readiness over a larger geographical area than urban facilities. The KDE bandwidth (h) was 12.28 (standard error (SE)=0.16) for rural facilities and 7.14 (SE=0.016) for urban facilities. The bandwidth is the standard deviation of the kernel density around each health facility, measured in kilometers. Controlling for covariates, cluster-level service readiness was significantly associated with facility-based birth (adjusted log-odds=0.031; robust SE=0.011). Among the other covariates, age, socioeconomic status, birth order, and rural versus urban sampling cluster were all significantly associated with facility-based birth.
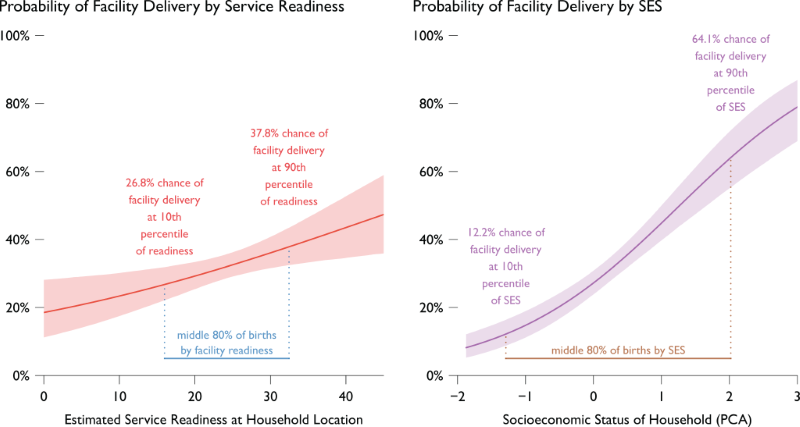
We investigate the substantive implications of the model using two simulation exercises. First, we simulate the predicted probability of facility birth given a range of cluster-level readiness scores and all other covariates held at their means (Figure 2). Under these counterfactual scenarios, the probability of facility birth rises from 26.8% (95% confidence interval [CI]: 22.0% to 32.0%) to 37.8% (95% CI=32.5% to 43.5%) as readiness rises from the 10th to the 90th percentile of the observed distribution. For comparison, shifting socioeconomic status from the 10th to 90th percentile raises the probability of facility birth from 12.2% (95% CI=8.8% to 16.4%) to 64.2% (95% CI=55.6% to 72.1%). Second, we simulate the in-sample increase in facility births for all 1991 fully observed births, given their diverse factual covariate values and a one-standard deviation increase in facility readiness at each location. If facility readiness were uniformly one standard deviation higher, but no other covariates changed, facility births would rise by 12.0% (95% CI=+3.5% to +20.4%). For comparison, if socioeconomic status had been uniformly one standard deviation higher, in-sample facility births would increase by 45.2% (95% CI=+34.6% to +55.8%).

DISCUSSION
We used a novel maximum likelihood estimation technique to assess the association between the quality of a woman’s delivery-related health service environment and her use of facility delivery care in Haiti. Adjusting for known predictors like mother’s socioeconomic status, age, and birth order, we found that cluster-level service readiness was significantly associated with likelihood of facility birth. This is in agreement with previous analyses of this data, using techniques prone to misclassification error, that also found a positive association.19,20 As has been recommended repeatedly in the literature,9 albeit with limited empirical support, it is likely that Haiti can increase rates of facility delivery by improving facility readiness to offer delivery-related services, independent of strides in broad-scale poverty reduction or gains in educational attainment.
Our work suggests that systems-level interventions could reduce the steep drop off between uptake of antenatal services and uptake of labor and delivery services in Haiti. However, empirical evidence on targeted, yet effective systems-level interventions to improve utilization of maternal health services is limited.34 A 2015 Cochrane systematic review examined supply-side interventions aimed at health systems, such as policy changes, health worker training, and re-organization of health services, as well as community-level demand-side interventions, such as information-education-communication (IEC) or financial incentives. The pooled results found no significant differences in the odds of facility delivery for 5 multi-component systems-level interventions (OR=1.53, 95% CI=0.96-2.43).34 Two systems-level interventions in rural Pakistan exemplified the lack of clear evidence for effective approaches. Bhutta et al (2011) conducted a cluster-randomized trial of a community-level intervention engaging lay health workers and community health committees, about half of which established emergency transport funds for safe delivery. A modest, marginally significant increase of 10% in facility births was observed during the study follow-up, with a highly significant improving time trend in the intervention communities only (54% vs. 44%, P=0.07; P=0.002 for time trend).35 Midhet et al (2010) also used a cluster randomized design to study a multi-component intervention of community-level IEC for both women and men, establishing of emergency transportation and communication networks, equipping of district health centers for emergency obstetric care and training health workers in safe maternal and neonatal care. This trial demonstrated null results with respect to health facility delivery.36 A systems-level trial designed to improve maternity care through midwife training, community-level IEC, and improving equipment in health centers in China found challenges in implementation and observed null results with respect to hospital delivery.37
Our analytic approach had several advantages over previous work. We linked household- and facility-level data and produced estimates of women’s access to quality delivery-related services near the time of childbirth for all DHS sampling clusters. Previous attempts have excluded sampling clusters located beyond an arbitrarily fixed distance from health facilities, introducing the potential for serious selection bias given the likelihood that people in remote clusters behave differently than people in non-remote clusters.19,20 Moreover, our analysis implicitly acknowledges the well-established notion that access to healthcare is a product of the quality of nearby facilities and their distance.7 By subtracting facility density from readiness-weighted density, we were able to model the incremental effect of improvements to facility readiness, independent of increases in the number of health facilities. Finally, unlike previous studies,21 we did not arbitrarily set the bandwidth parameters for our KDE. Rather, we used maximum likelihood methods to find parameter values that maximize the likelihood of making the observations given the parameters. Our results suggest that rural facilities have greater reach than urban facilities, affecting the service readiness environment for women across larger catchment areas.
Our approach also had several limitations. Our analysis was cross-sectional, and the DHS birth data were collected before the SPA facility data, meaning the results must be interpreted with caution. However, even though the SPA data was collected in 2013, we believe that it offered plausible estimates of the service readiness environment surrounding births occurring in 2011 or 2012, given that health facility readiness tends to be stable over a two-year timeframe. Longitudinal data from repeat DHS and SPA surveys would improve our analysis. Our results rely on the completeness, consistency, and validity of the DHS and SPA datasets. Fortunately, the 2012 Haiti DHS was a nationally representative household survey, and the 2013 Haiti SPA was a census of almost all health facilities in the country. Moreover, the SPA used observation of equipment and services rather than self-reported data, improving the validity of the readiness data used in our analysis. Other limitations relate to the measurement of service readiness within SPA. We used a composite service readiness score summarizing all 70 binary general and delivery-related SARA indicators. This score cannot discriminate between a facility adding latex gloves to its inventory from one acquiring electricity. Further work should test whether the service readiness factors measured by SPA actually align with the areas of quality that most drive demand for facility-based maternity services. A recent systematic review of qualitative studies on barriers and facilitators of facility births revealed key barriers such as lack of privacy, abuse and neglect during facility delivery, policies for compulsory HIV testing or fear of disclosure, and stigmatizing attitudes toward unwed pregnant women.11 SPA assessments emphasize infrastructure factors (staffing and training, equipment, diagnostics, and medicines) and may not capture other key attributes of quality health care: namely the presence of respectful, non-abusive, non-stigmatizing services. Finally, our analysis did not consider the mechanisms by which service readiness may affect propensity for facility-based delivery. Community-level awareness of available maternal and child health services and use of antenatal care may be important mediators of this relationship, though our analysis was constrained by lack of data on awareness levels.
CONCLUSIONS
In conclusion, our results suggest that health system policymakers in Haiti could increase rates of facility-based birth by supporting targeted interventions to improve facility readiness to provide delivery-related services, alongside efforts to reduce poverty and increase educational attainment among women. Given resource constraints and profound, persistent weaknesses in Haiti’s public-sector health system, evidence about comparative effectiveness of various approaches to improving accessibility and readiness of maternity services will be of great importance and interest to policymakers and other stakeholders. Our study is a step on a pathway towards a more precise study of health system readiness. Future analytic approaches could aim to comprehensively measure quality and readiness, and weight the components of quality and readiness scores relative to their difficulty or cost to attain. In the complex interplay between demand and supply factors in maternal care, this type of analysis would give decision-makers critical information about the most promising investments to make to improve use of facility-based labor and delivery services.
Acknowledgements
We wish to thank the participants of the 2012 Haiti DHS and 2013 Haiti SPA. We greatly appreciate research support from the Center for Statistics and the Social Sciences at the University of Washington, Seattle.
Funding
Support for the payment of an open access fee was provided by the Center for Statistics and the Social Sciences at the University of Washington, Seattle.
Competing interests
The authors completed the Unified Competing Interest form at http://www.icmje.org/coi_disclosure.pdf (available upon request from the corresponding author), and declare no conflict of interest.
Correspondence to:
Christopher Kemp
Department of Global Health
University of Washington
Ninth and Jefferson Building
13th Floor
Box 359932
908 Jefferson Street
Seattle, WA 98104
United States of America
[email protected]